KO Weekly Technical Analysis
Coca-Cola
World’s largest beverage company (Coke, Sprite, Fanta)
KO Technical Analysis Summary
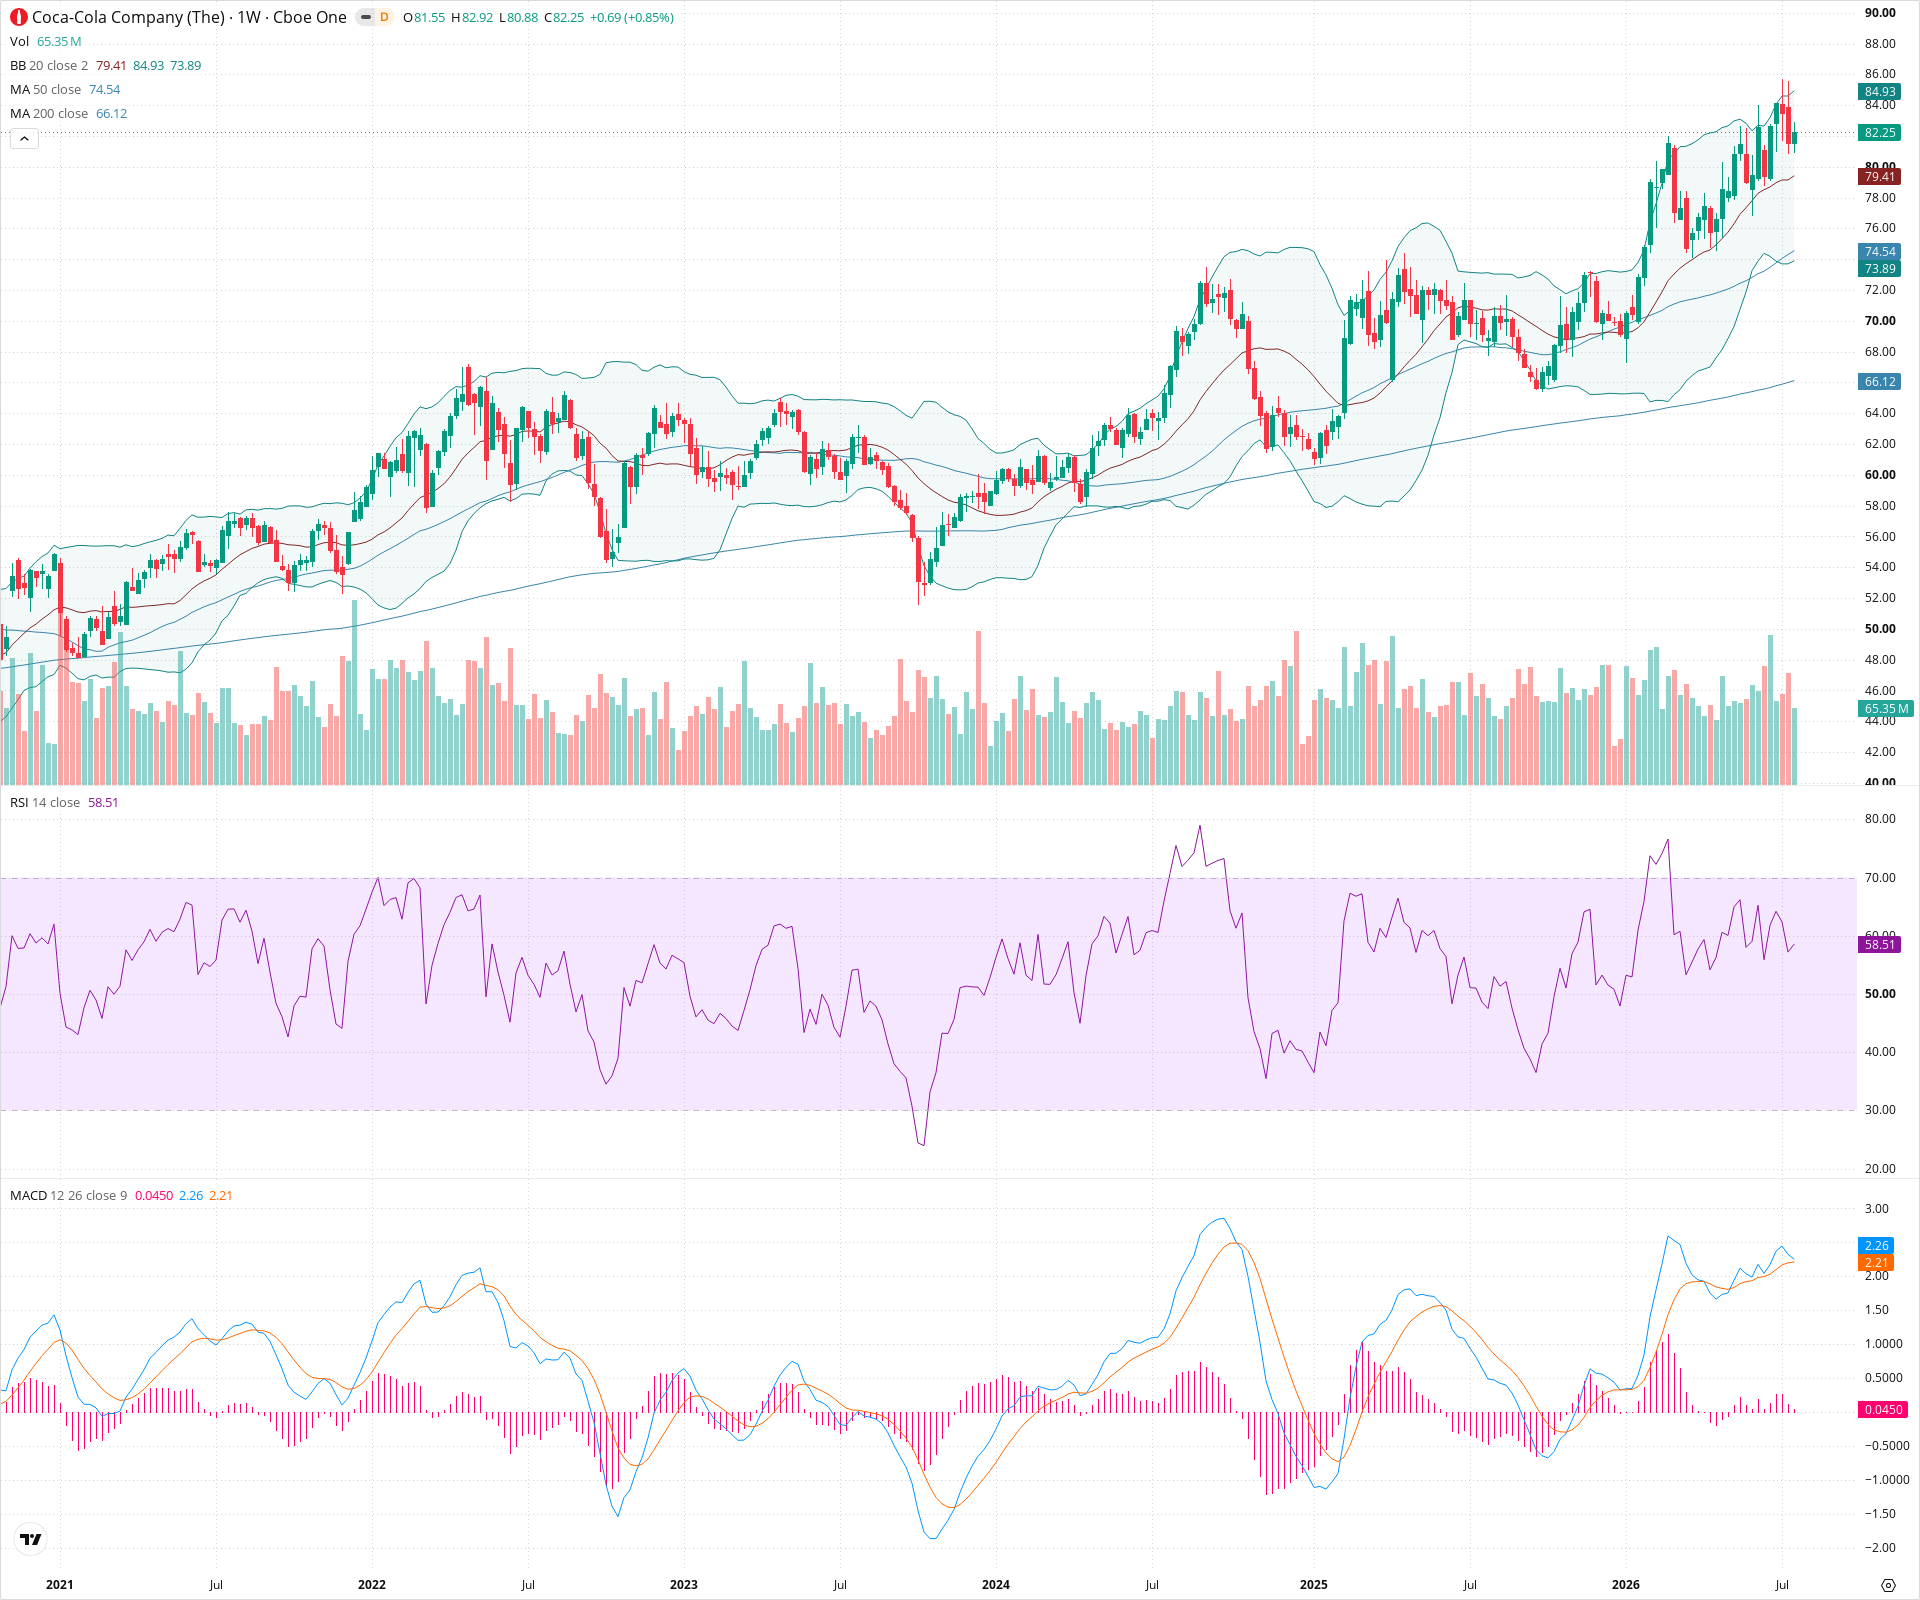
KO exhibits a very strong technical posture on the weekly timeframe, characterized by a persistent long-term uptrend. The recent price action confirms a solid breakout from a lengthy consolidation period, with momentum indicators like RSI and MACD supporting further upside. While minor pullbacks to retest the 78-80 breakout zone are normal, the broader trend remains firmly bullish as long as major moving averages hold as support.
Included In Lists
Related Tickers of Interest
KO Weekly Chart
Sentiment
Short-term Sentiment (days to weeks): Bullish
Price action is strong, pushing out of a recent consolidation phase, riding the upper Bollinger Band, and staying well above a rising 20-week SMA.
Long-term Sentiment (weeks to months): Bullish
The chart displays a clear multi-year uptrend with the price positioned significantly above upward-sloping 50-week and 200-week moving averages, confirming sustained long-term strength.
Report Metadata
- Timeframe: weekly
- Generated at: 2026-07-25T09:04:50.498Z
- Model: gemini-3.1-pro-preview
Support Price Levels
| Level | Range | Strength | Notes |
|---|---|---|---|
| $79.00 | $78.00 - $80.00 | Strong | Recent breakout zone and psychological level, currently aligning with the rising 20-period SMA. |
| $75.00 | $74.00 - $76.00 | Strong | Prior multi-month resistance turned support, converging with the 50-period SMA. |
| $67.00 | $66.00 - $68.00 | Strong | Major structural swing low and proximity to the 200-period SMA, acting as the long-term trend base. |
Resistance Price Levels
| Level | Range | Strength | Notes |
|---|---|---|---|
| $84.50 | $84.00 - $85.00 | Weak | Immediate overhead resistance based on recent upper wick extensions and psychological round numbers in price discovery. |
| $89.00 | $88.00 - $90.00 | Weak | Next major psychological levels if the current upward momentum continues unabated. |
Potential Chart Patterns in Formation
| Strength | Pattern | Signal | Target | Details |
|---|---|---|---|---|
| Strong | Bullish Breakout / Trend Continuation | Bullish | N/A | Price has successfully broken out above prior structural resistance around 76-78 and is currently extending that uptrend, supported by bullish MA alignment and a positive MACD. |
Frequently Asked Questions about KO
What is the current sentiment for KO?
The short-term sentiment for KO is currently Bullish because Price action is strong, pushing out of a recent consolidation phase, riding the upper Bollinger Band, and staying well above a rising 20-week SMA.. The long-term trend is classified as Bullish.
What are the key support levels for KO?
StockDips.AI has identified key support levels for KO at $79.00 and $75.00. These levels may represent potential accumulation zones where buying interest could emerge.
Is KO in a significant dip or a Value Dip right now?
KO has a Value Score of 67/100. It is not currently flagged as a significant dip in the Top Dips list. It is not listed as a Value Dip because the long-term sentiment or value-score threshold does not qualify.
View the full interactive analysis on StockDips.AI.