WMT Daily Technical Analysis
Walmart Inc.
The world’s largest retailer, operating a global chain of supercenters, discount stores, and grocery outlets. Walmart also runs a massive e-commerce platform, logistics network, and financial services ecosystem.
WMT Technical Analysis Summary
The technical posture for this asset has suffered a severe breakdown, characterized by a massive high-volume gap down that shattered the prior long-term uptrend. The price is currently pinned near its lows and well below all major moving averages, with a confirming 'Death Cross' underway. While extreme oversold conditions on the RSI may spark a short-term relief rally, the overarching structure is highly defensive, and significant overhead resistance must be cleared to neutralize the bearish bias.
Included In Lists
Related Tickers of Interest
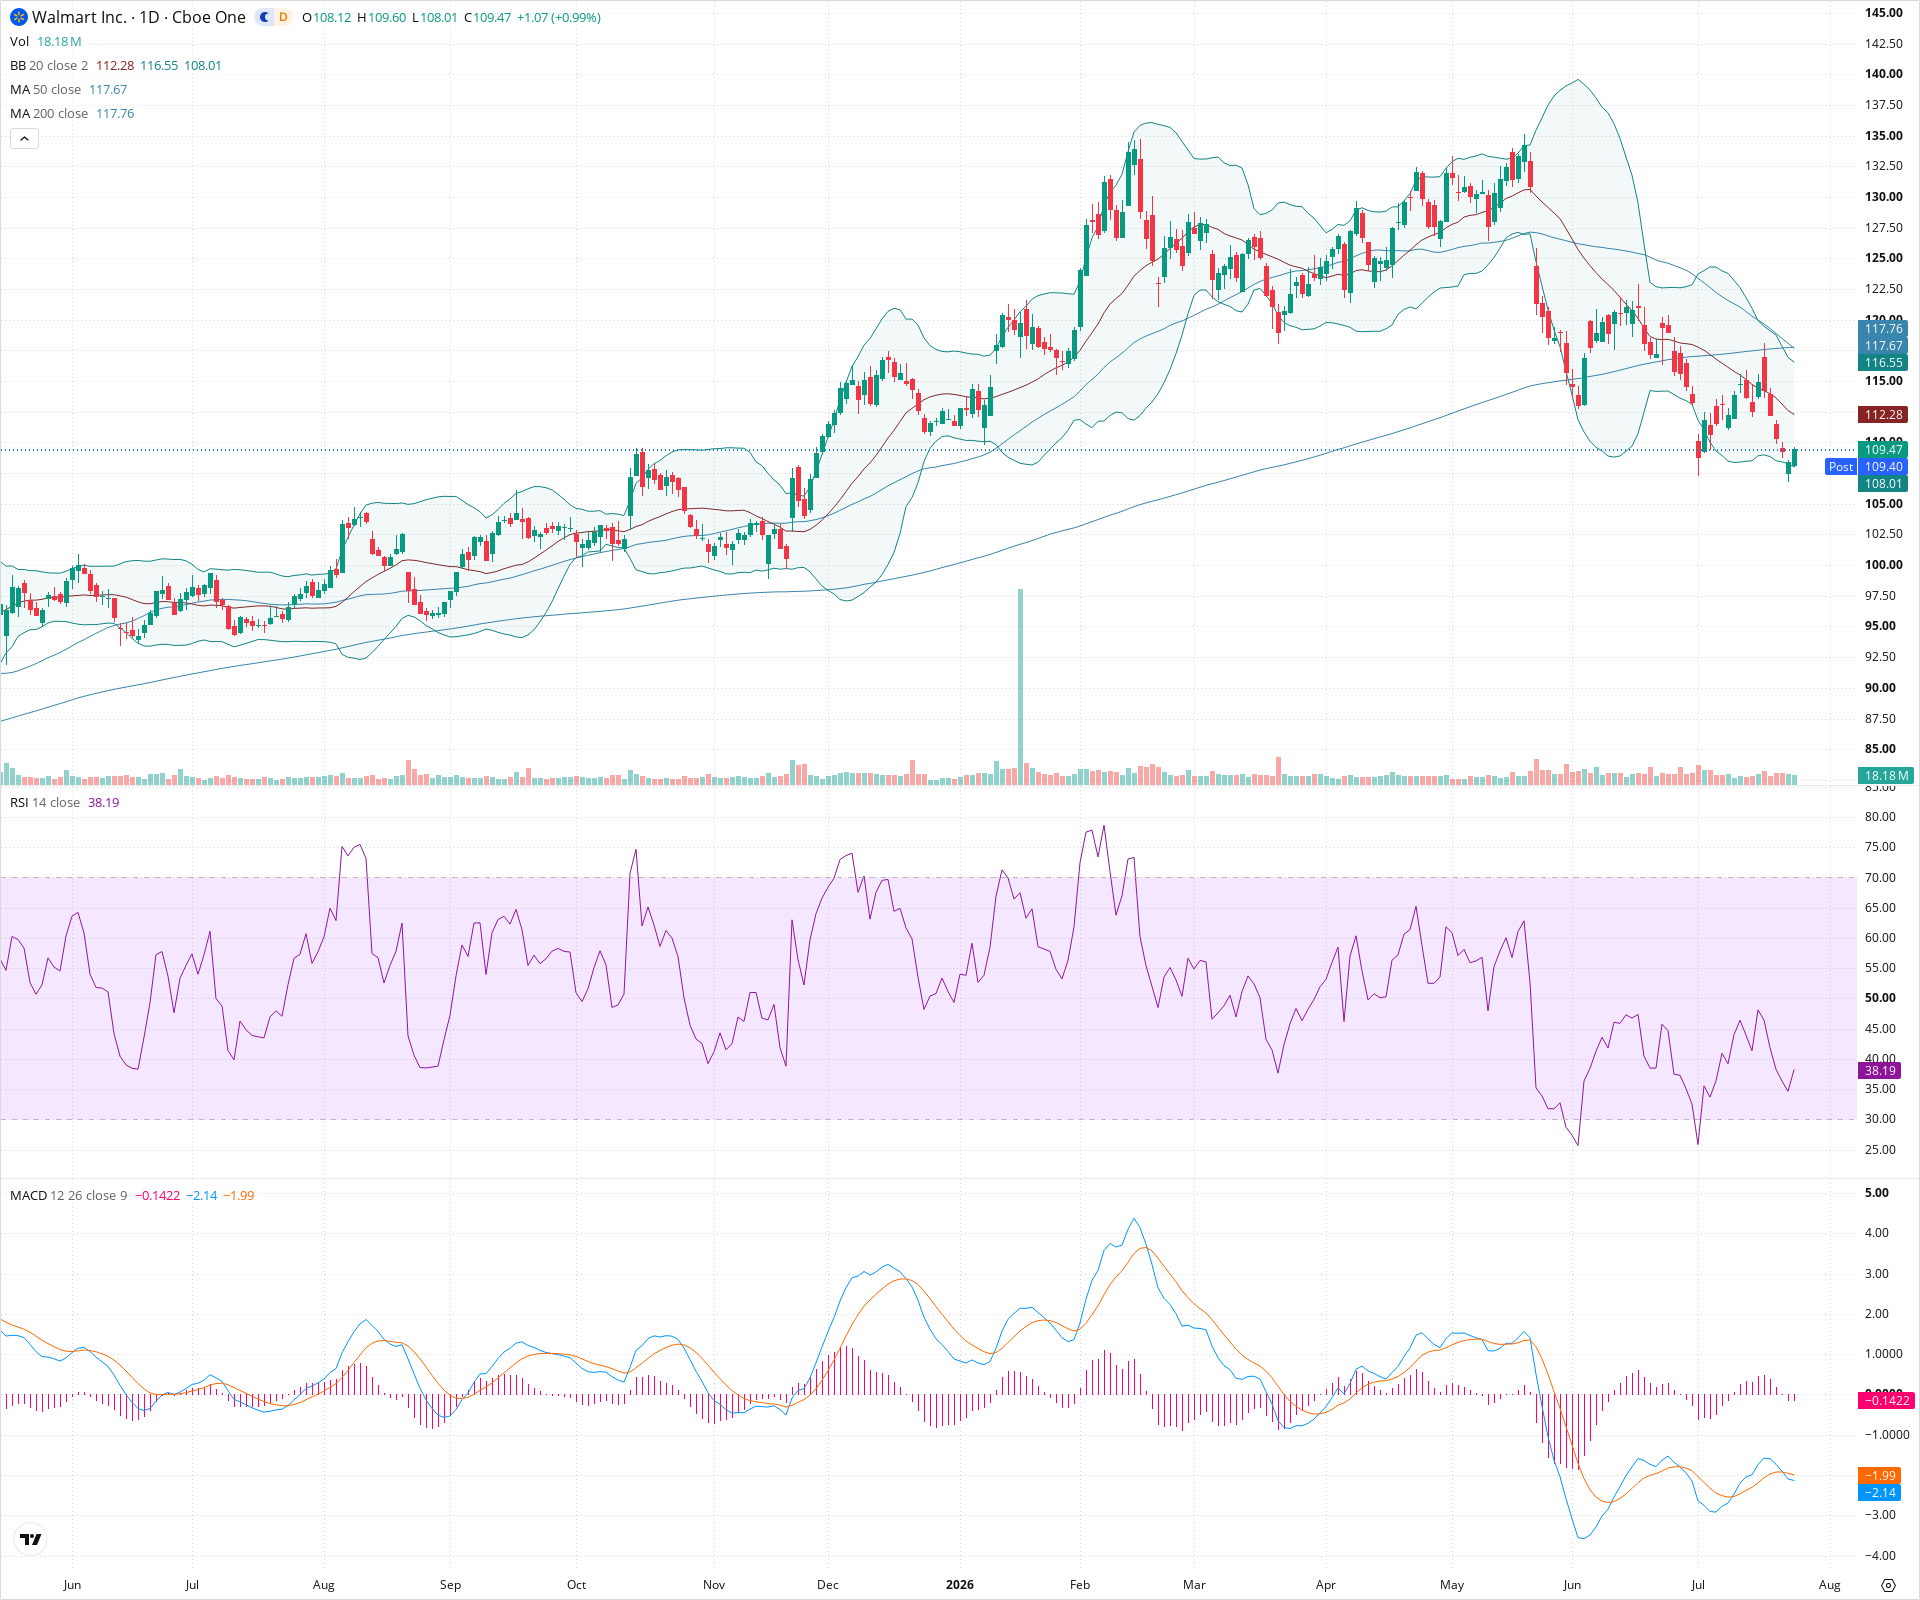
WMT Daily Chart
Sentiment
Short-term Sentiment (days to weeks): Bearish
Price action is dominated by a recent high-volume gap down, placing it below all short-term moving averages. The MACD remains deep in negative territory, though a slight uptick in RSI suggests minor oversold relief.
Long-term Sentiment (weeks to months): Bearish
The long-term uptrend has structurally broken, evidenced by the price crashing well below the 200-day SMA and a 'Death Cross' forming between the 50-day and 200-day SMAs.
Report Metadata
- Timeframe: daily
- Generated at: 2026-07-24T21:04:19.398Z
- Model: gemini-3.1-pro-preview
Support Price Levels
| Level | Range | Strength | Notes |
|---|---|---|---|
| $108.50 | $107.50 - $109.50 | Strong | Immediate support zone established by the post-gap consolidation and recent swing lows. |
| $101.50 | $100.00 - $103.00 | Weak | Historical consolidation area from the previous year prior to the major uptrend. |
| $96.25 | $95.00 - $97.50 | Strong | Major structural swing low on the far left of the chart. |
Resistance Price Levels
| Level | Range | Strength | Notes |
|---|---|---|---|
| $113.00 | $112.00 - $114.00 | Weak | Initial resistance at the declining 20-day SMA and recent minor bounce highs. |
| $117.25 | $116.50 - $118.00 | Strong | Heavy resistance zone where the 50-day and 200-day SMAs are converging. |
| $126.25 | $125.00 - $127.50 | Strong | The bottom edge of the massive gap down; significant overhead supply. |
Potential Chart Patterns in Formation
| Strength | Pattern | Signal | Target | Details |
|---|---|---|---|---|
| Strong | Bearish Gap Down / Breakdown | Bearish | N/A | A massive, high-volume gap below prior support and the 200-day SMA, signifying a violent shift in trend momentum. |
| Strong | Death Cross | Bearish | N/A | The 50-day SMA (117.67) is crossing below the 200-day SMA (117.76), acting as a lagging confirmation of a long-term bearish trend change. |
Frequently Asked Questions about WMT
What is the current sentiment for WMT?
The short-term sentiment for WMT is currently Bearish because Price action is dominated by a recent high-volume gap down, placing it below all short-term moving averages. The MACD remains deep in negative territory, though a slight uptick in RSI suggests minor oversold relief.. The long-term trend is classified as Bearish.
What are the key support levels for WMT?
StockDips.AI has identified key support levels for WMT at $108.50 and $101.50. These levels may represent potential accumulation zones where buying interest could emerge.
Is WMT in a significant dip or a Value Dip right now?
WMT has a Value Score of 79/100. It is currently flagged as a significant dip in the Top Dips list. It is not listed as a Value Dip because the long-term sentiment or value-score threshold does not qualify.
View the full interactive analysis on StockDips.AI.