KO Monthly Technical Analysis
Coca-Cola
World’s largest beverage company (Coke, Sprite, Fanta)
KO Technical Analysis Summary
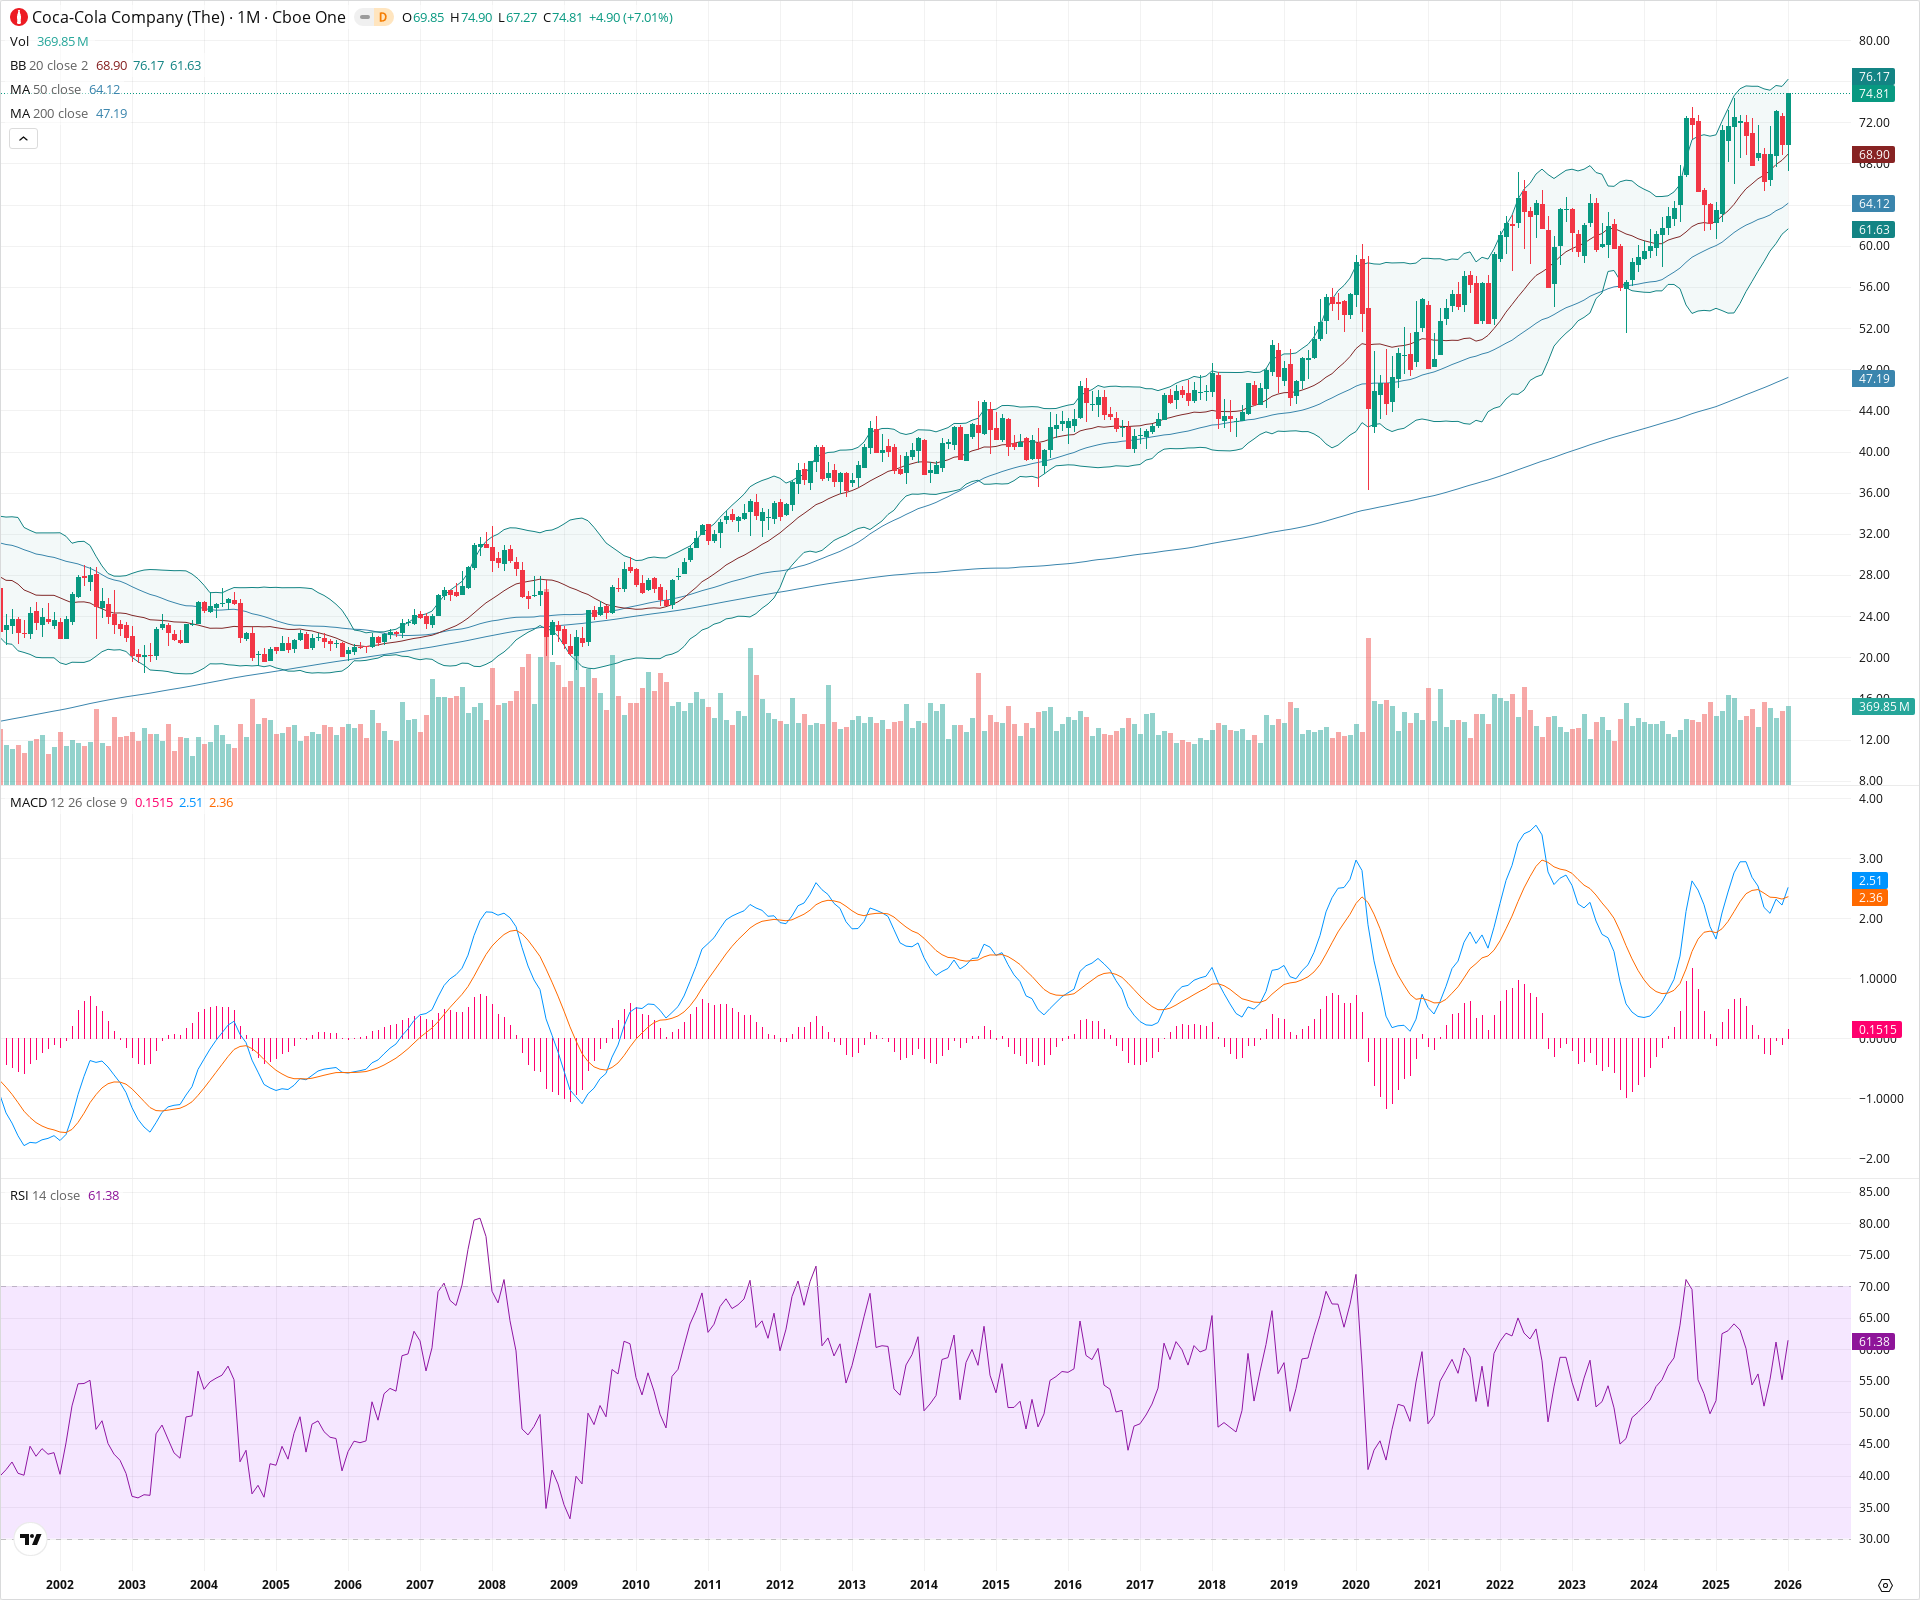
Coca-Cola (KO) exhibits a robust long-term bullish structure, evidenced by the price trading at new highs above a rising 200-month SMA. The stock recently cleared a significant multi-year consolidation zone near $67, triggering a breakout confirmed by expanding Bollinger Bands and a bullish MACD posture. Momentum indicators like RSI remain in healthy bullish territory without being excessively overextended, suggesting the prevailing uptrend remains intact.
Included In Lists
Related Tickers of Interest
KO Monthly Chart
Sentiment
Short-term Sentiment (days to weeks): Bullish
Price is trading near all-time highs with a strong monthly candle, riding near the upper Bollinger Band, and supported by a positive MACD crossover.
Long-term Sentiment (weeks to months): Bullish
The stock is in a clear secular uptrend with perfect bullish alignment of moving averages (20 > 50 > 200), and RSI holding above 60 confirms a strong bull regime.
Report Metadata
- Timeframe: monthly
- Generated at: 2026-02-02T06:25:16.611Z
- Model: gemini-3-pro-preview
Support Price Levels
| Level | Range | Strength | Notes |
|---|---|---|---|
| $65.50 | $64.00 - $67.00 | Strong | Former major resistance zone (2022-2023 highs) now turned support, reinforced by the 50-month SMA. |
| $59.00 | $58.00 - $60.00 | Weak | Recent consolidation support and lower range of the previous trading block. |
| $47.50 | $47.00 - $48.00 | Strong | Secular support defined by the 200-month SMA. |
Resistance Price Levels
| Level | Range | Strength | Notes |
|---|---|---|---|
| $76.34 | $76.17 - $76.50 | Weak | Dynamic resistance at the Upper Bollinger Band. |
| $80.00 | $80.00 - $80.00 | Weak | Psychological round number extension target. |
Potential Chart Patterns in Formation
| Strength | Pattern | Signal | Target | Details |
|---|---|---|---|---|
| Strong | Consolidation Breakout | Bullish | N/A | Price has successfully broken out above the multi-year resistance cap around $67 after consolidating since early 2022. |
Frequently Asked Questions about KO
What is the current sentiment for KO?
The short-term sentiment for KO is currently Bullish because Price is trading near all-time highs with a strong monthly candle, riding near the upper Bollinger Band, and supported by a positive MACD crossover.. The long-term trend is classified as Bullish.
What are the key support levels for KO?
StockDips.AI has identified key support levels for KO at $65.50 and $59.00. These levels may represent potential accumulation zones where buying interest could emerge.
Is KO in a significant dip or a Value Dip right now?
KO has a Value Score of 67/100. It is not currently flagged as a significant dip in the Top Dips list. It is not listed as a Value Dip because the long-term sentiment or value-score threshold does not qualify.
View the full interactive analysis on StockDips.AI.