SBUX Monthly Technical Analysis
Starbucks Corporation
Global coffeehouse chain offering beverages, food, and packaged goods through more than 35,000 locations worldwide.
SBUX Technical Analysis Summary
SBUX is staging a significant rebound from a critical long-term support zone around $71, supported by a bullish MACD crossover and strong monthly momentum. The stock is currently testing the 50-month SMA, a key dynamic resistance level within its multi-year consolidation pattern. While the secular trend represented by the 200-month SMA remains positive, the stock is effectively range-bound between $70 and $115. A sustained break above $115 is required to confirm a resumption of the primary bull market.
Included In Lists
Related Tickers of Interest
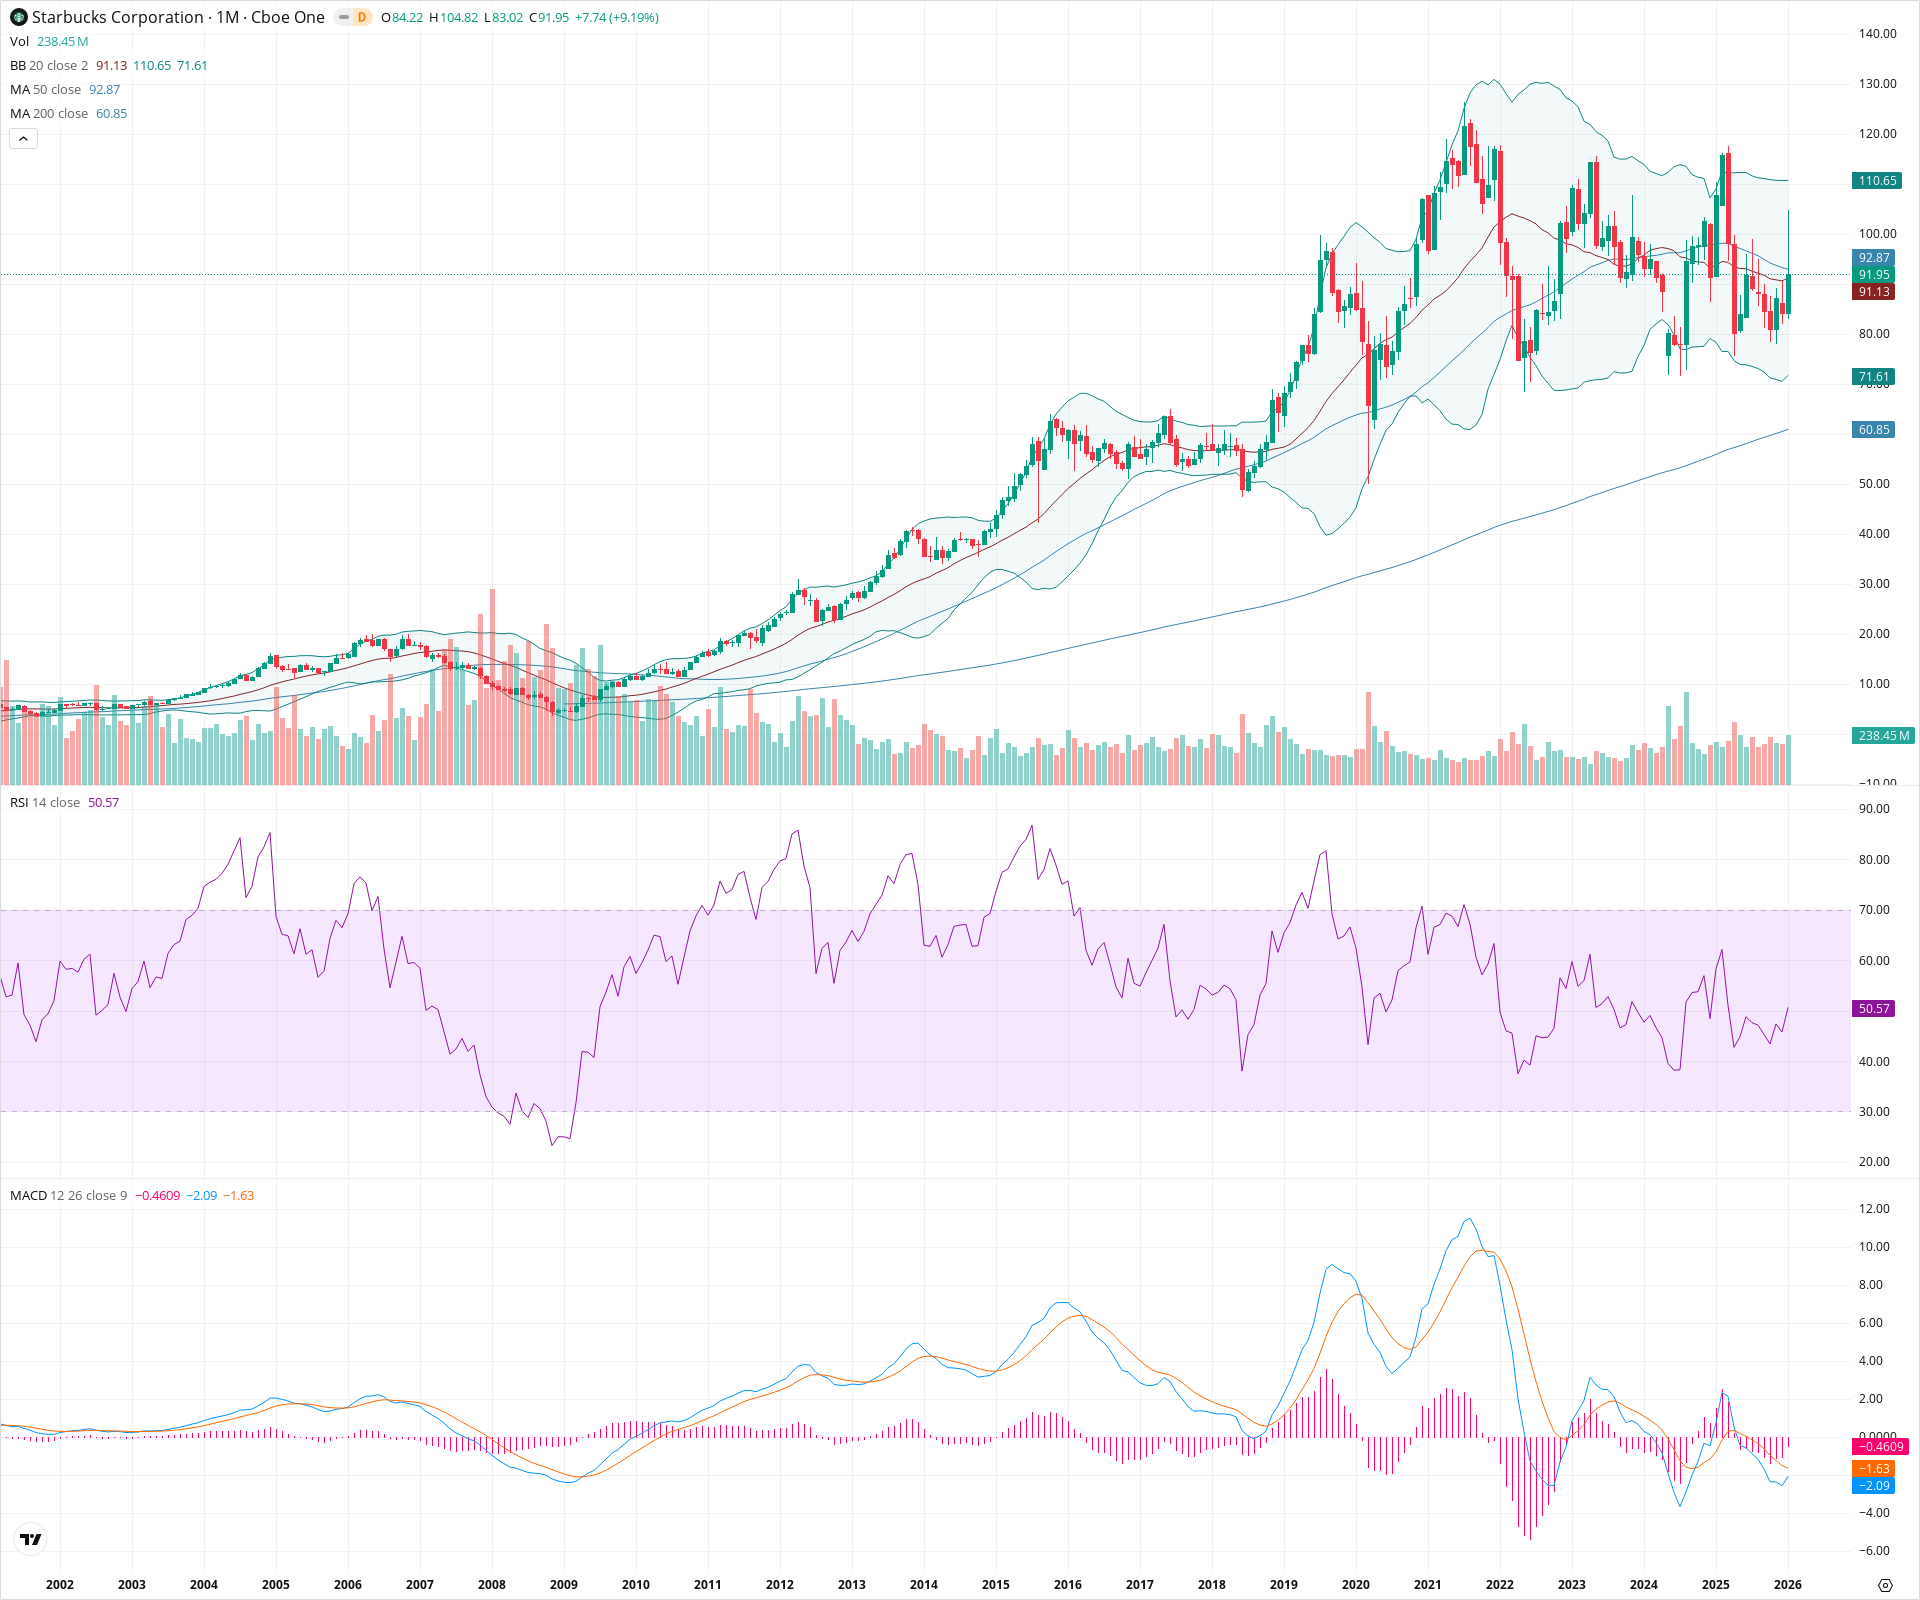
SBUX Monthly Chart
Sentiment
Short-term Sentiment (days to weeks): Bullish
Current monthly candle is a strong engulfing green bar (+9.19%) rebounding from major structural support. MACD histogram has flipped positive with a bullish crossover, and price is reclaiming the middle Bollinger Band.
Long-term Sentiment (weeks to months): Neutral
Stock remains trapped in a multi-year consolidation range (roughly $70-$126) since mid-2021. While the 200-month SMA provides a rising secular floor, price is still below the 50-month SMA and has made lower swing highs since the ATH.
Report Metadata
- Timeframe: monthly
- Generated at: 2026-02-02T06:55:08.330Z
- Model: gemini-3-pro-preview
Support Price Levels
| Level | Range | Strength | Notes |
|---|---|---|---|
| $71.50 | $70.00 - $73.00 | Strong | Major multi-year horizontal support zone; marks the lows of 2022 and 2024 (potential double bottom area). |
| $60.50 | $60.00 - $61.00 | Strong | Coincides with the rising 200-month SMA, representing the long-term secular trend floor. |
Resistance Price Levels
| Level | Range | Strength | Notes |
|---|---|---|---|
| $93.94 | $92.87 - $95.00 | Weak | Immediate resistance at the 50-month SMA (92.87) and recent congestion area. |
| $114.00 | $113.00 - $115.00 | Strong | Major swing high from 2023; upper boundary of the recent trading range. |
| $127.00 | $126.00 - $128.00 | Strong | All-time high set in 2021. |
Potential Chart Patterns in Formation
| Strength | Pattern | Signal | Target | Details |
|---|---|---|---|---|
| Strong | Consolidation Range / Double Bottom | Bullish | $115.00 | Price has established a potential large double bottom structure with lows in 2022 and 2024 around the $70 level, within a broader sideways range. |
Frequently Asked Questions about SBUX
What is the current sentiment for SBUX?
The short-term sentiment for SBUX is currently Bullish because Current monthly candle is a strong engulfing green bar (+9.19%) rebounding from major structural support. MACD histogram has flipped positive with a bullish crossover, and price is reclaiming the middle Bollinger Band.. The long-term trend is classified as Neutral.
What are the key support levels for SBUX?
StockDips.AI has identified key support levels for SBUX at $71.50 and $60.50. These levels may represent potential accumulation zones where buying interest could emerge.
Is SBUX in a significant dip or a Value Dip right now?
SBUX has a Value Score of 82/100. It is currently flagged as a significant dip in the Top Dips list. It is not listed as a Value Dip because the long-term sentiment or value-score threshold does not qualify.
View the full interactive analysis on StockDips.AI.