WMT Weekly Technical Analysis
Walmart Inc.
The world’s largest retailer, operating a global chain of supercenters, discount stores, and grocery outlets. Walmart also runs a massive e-commerce platform, logistics network, and financial services ecosystem.
WMT Technical Analysis Summary
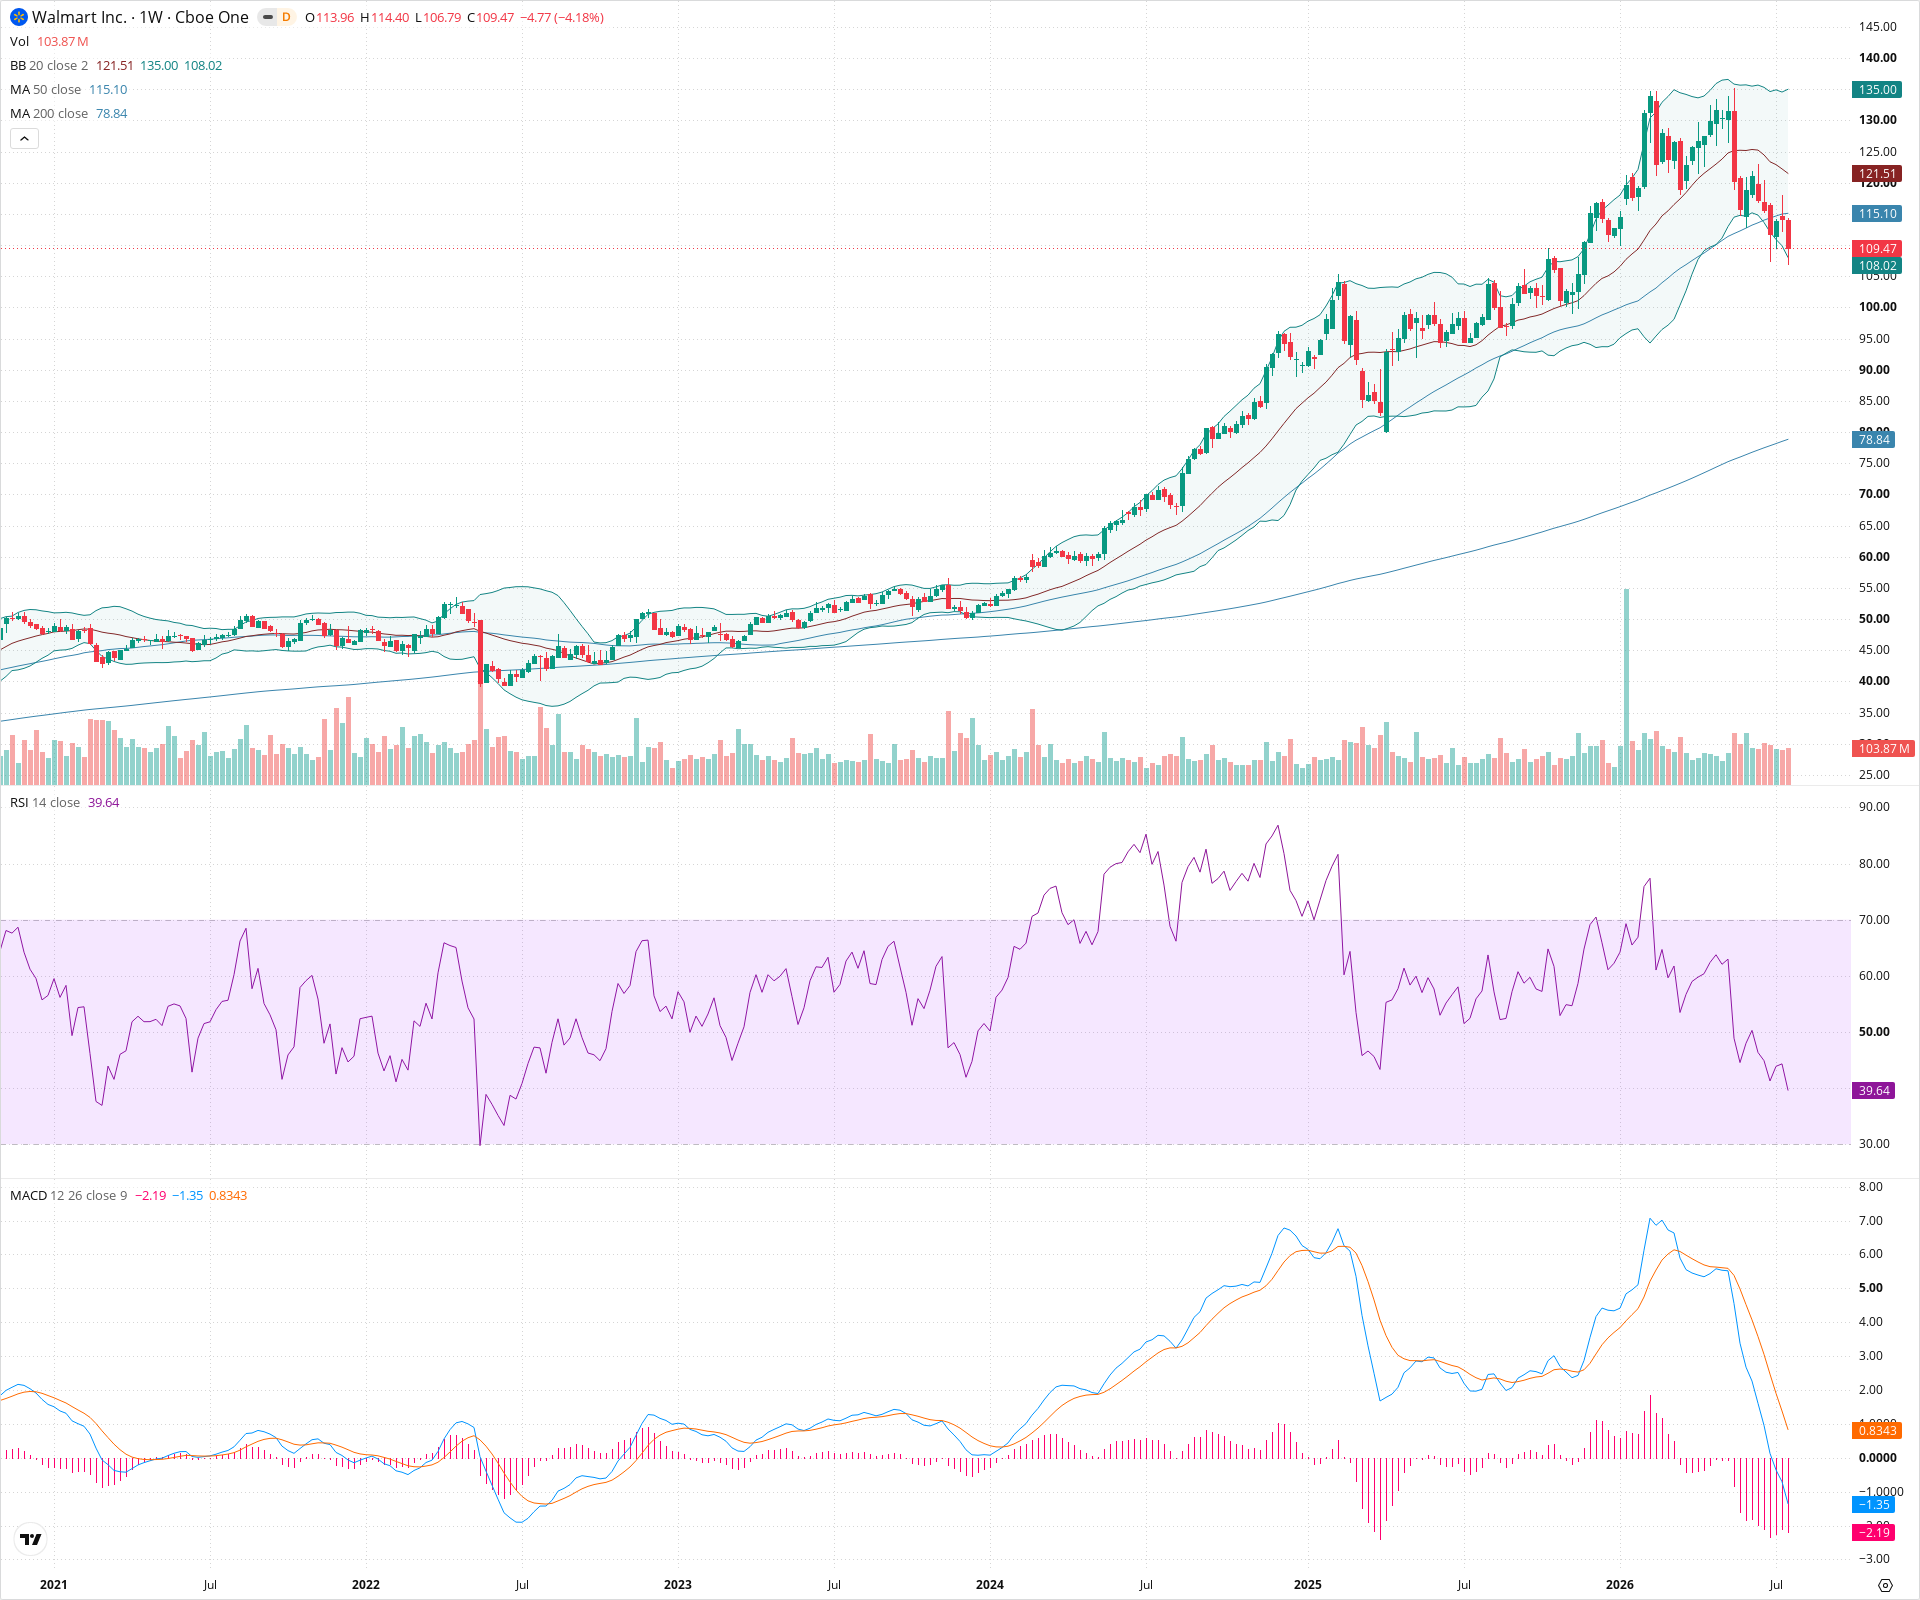
The long-term technical picture for WMT remains fundamentally bullish, underpinned by a multi-year uptrend and a rising 200-week SMA. However, intermediate-term investors face a distinctly bearish environment as the chart has executed a massive double top breakdown. The recent loss of the 50-week SMA, coupled with accelerating downward momentum in RSI and MACD, suggests the current corrective phase has further room to run, likely targeting the 95-102 support zone before stabilizing.
Included In Lists
Related Tickers of Interest
WMT Weekly Chart
Sentiment
Short-term Sentiment (days to weeks): Bearish
Price has aggressively broken down from a double top formation, plunging below the 50-week SMA. RSI is dropping sharply below 50, and MACD shows a strong bearish crossover with expanding negative histogram.
Long-term Sentiment (weeks to months): Bullish
Despite the severe recent correction, the broader multi-year macro structure remains intact. The price is still significantly above a steadily rising 200-week SMA, and the sequence of higher macro lows has not yet been compromised.
Report Metadata
- Timeframe: weekly
- Generated at: 2026-07-25T09:13:18.498Z
- Model: gemini-3.1-pro-preview
Support Price Levels
| Level | Range | Strength | Notes |
|---|---|---|---|
| $98.50 | $95.00 - $102.00 | Moderate | Prior multi-month consolidation zone before the final leg up; psychological round number area. |
| $78.50 | $75.00 - $82.00 | Strong | Major historical consolidation base and the current approximate location of the rising 200-week SMA. |
Resistance Price Levels
| Level | Range | Strength | Notes |
|---|---|---|---|
| $118.00 | $115.00 - $121.00 | Strong | Immediate overhead resistance consisting of the underside of the recently broken 50-week SMA and prior support turned resistance. |
| $137.50 | $135.00 - $140.00 | Strong | Major structural swing highs forming the peaks of the massive double top reversal pattern. |
Potential Chart Patterns in Formation
| Strength | Pattern | Signal | Target | Details |
|---|---|---|---|---|
| Strong | Double Top | Bearish | $100.00 | A massive, multi-month double top formation with peaks near 140. The pattern was confirmed upon breaking down below the intervening valley support around 120-121. |
Frequently Asked Questions about WMT
What is the current sentiment for WMT?
The short-term sentiment for WMT is currently Bearish because Price has aggressively broken down from a double top formation, plunging below the 50-week SMA. RSI is dropping sharply below 50, and MACD shows a strong bearish crossover with expanding negative histogram.. The long-term trend is classified as Bullish.
What are the key support levels for WMT?
StockDips.AI has identified key support levels for WMT at $98.50 and $78.50. These levels may represent potential accumulation zones where buying interest could emerge.
Is WMT in a significant dip or a Value Dip right now?
WMT has a Value Score of 79/100. It is currently flagged as a significant dip in the Top Dips list. It is also listed as a Value Dip because long-term sentiment is bullish.
View the full interactive analysis on StockDips.AI.