WMT Monthly Technical Analysis
Walmart Inc.
The world’s largest retailer, operating a global chain of supercenters, discount stores, and grocery outlets. Walmart also runs a massive e-commerce platform, logistics network, and financial services ecosystem.
WMT Technical Analysis Summary
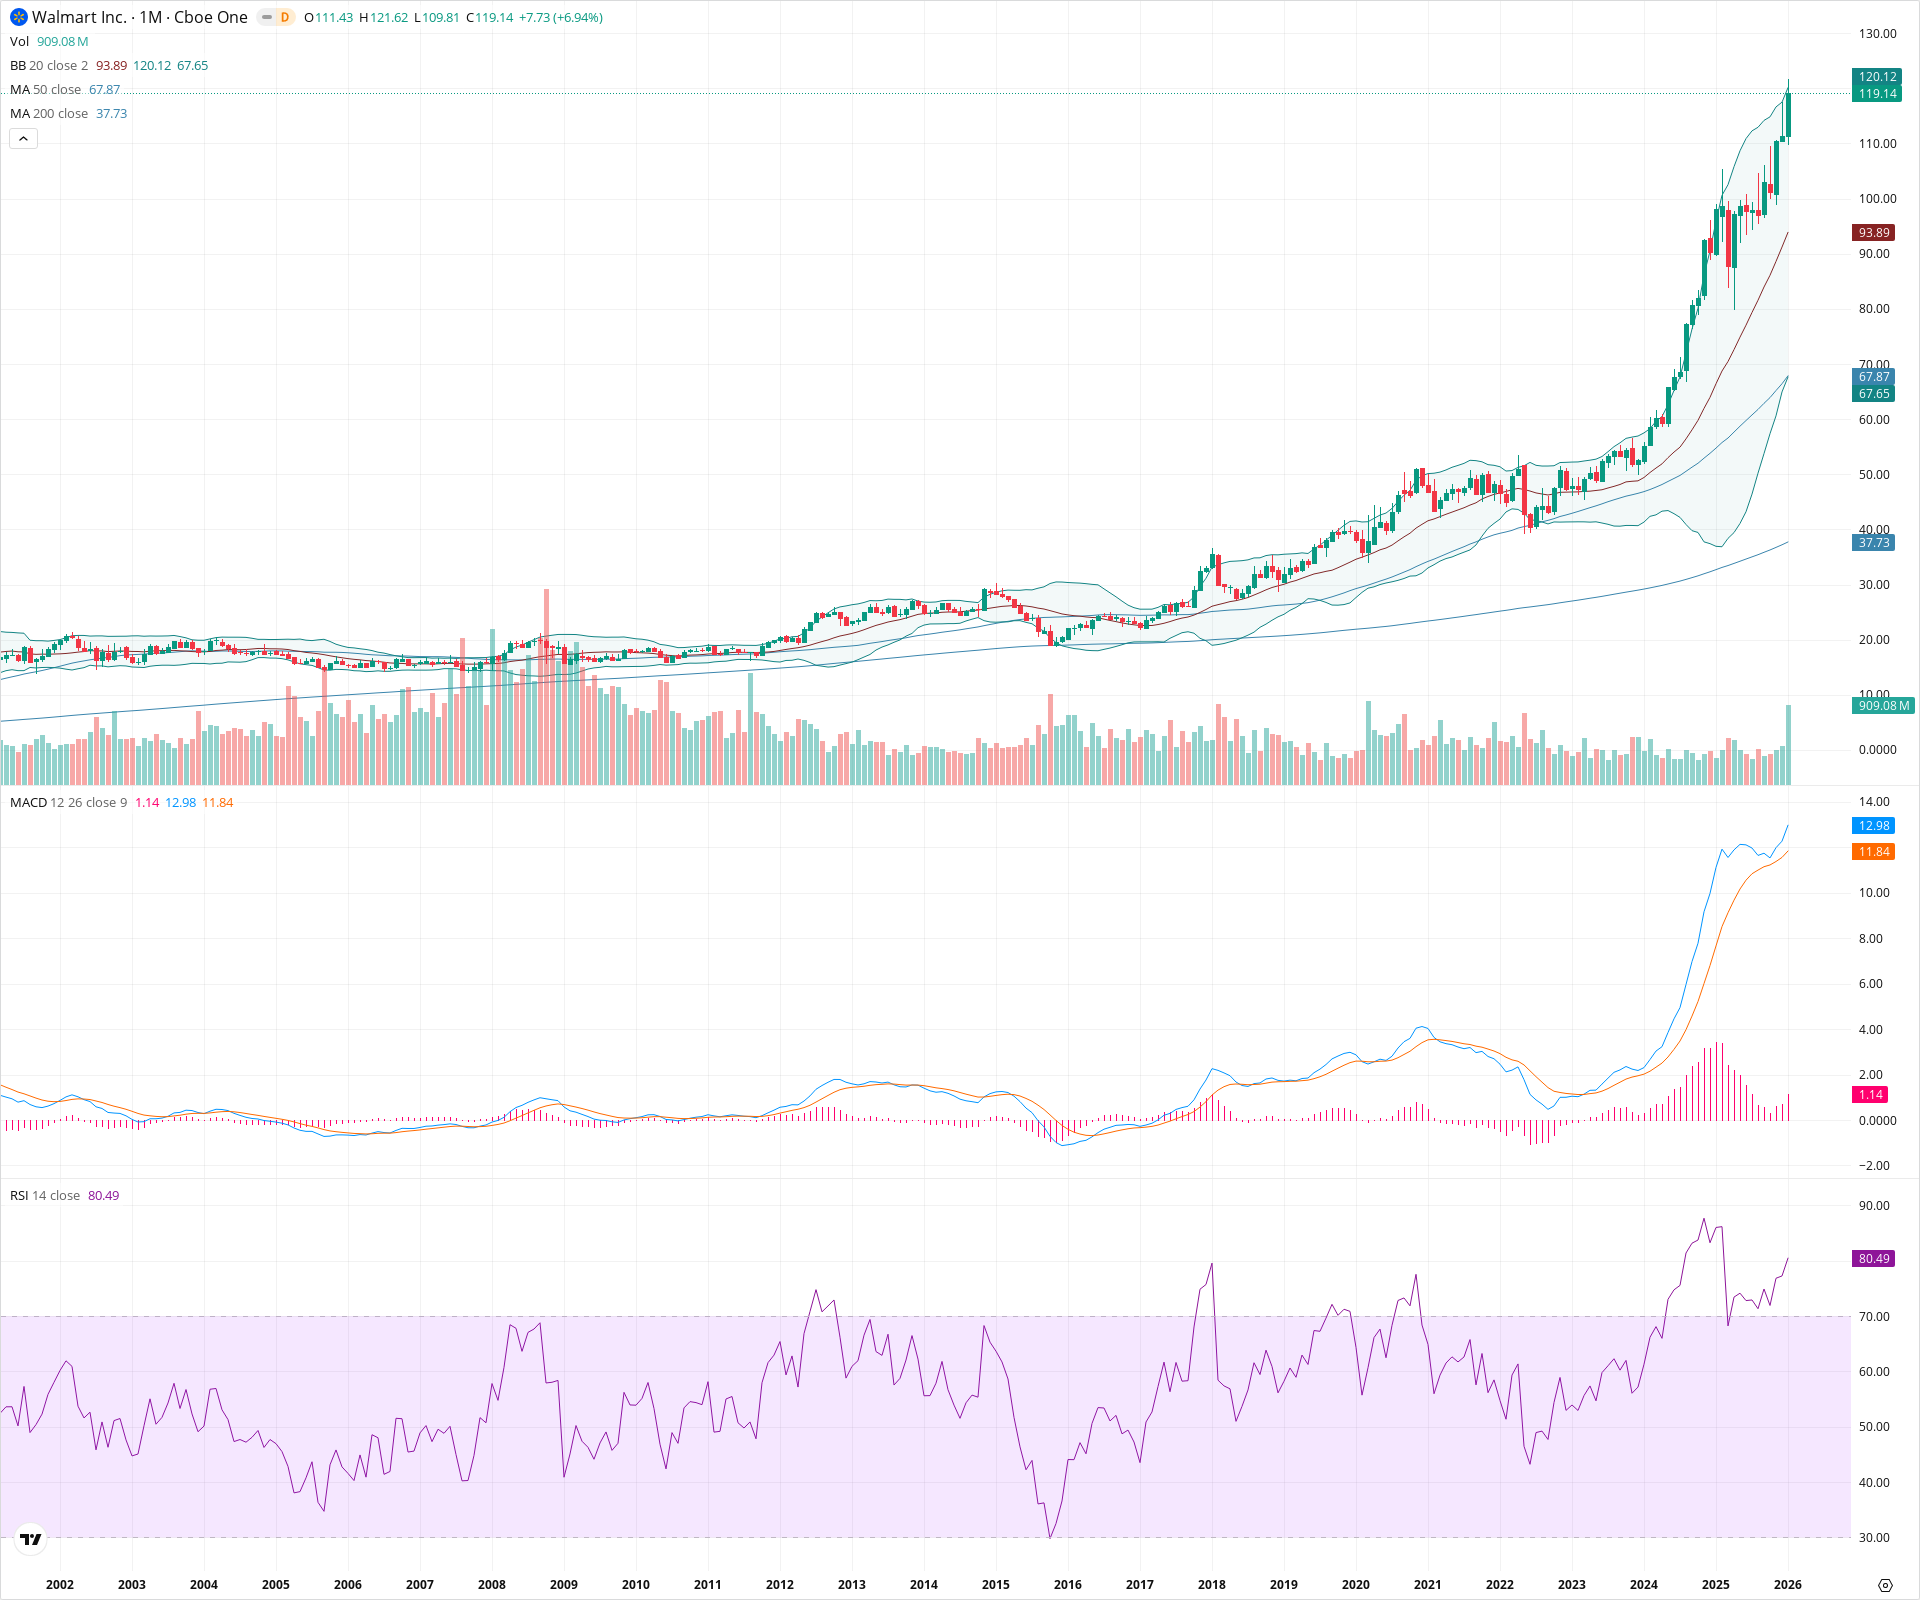
Walmart is in a powerful secular uptrend, currently in a price discovery phase after breaking out of a multi-year base near 50.00. The stock is exhibiting extreme momentum with RSI above 80 and price hugging the upper Bollinger Band, supported by a widening positive MACD histogram. While the vertical trajectory suggests a highly aggressive impulse, the long-term structure remains firmly bullish with all major moving averages trending upward.
Included In Lists
Related Tickers of Interest
WMT Monthly Chart
Sentiment
Short-term Sentiment (days to weeks): Bullish
Price is in a vertical ascent, trading near the upper Bollinger Band (120.12) with RSI > 80 confirming strong momentum.
Long-term Sentiment (weeks to months): Bullish
Secular bull regime defined by perfect fanning of moving averages (20 > 50 > 200) and MACD strongly positioned above the zero line.
Report Metadata
- Timeframe: monthly
- Generated at: 2026-02-02T07:00:05.040Z
- Model: gemini-3-pro-preview
Support Price Levels
| Level | Range | Strength | Notes |
|---|---|---|---|
| $93.50 | $93.00 - $94.00 | Strong | Aligns with the 20-month SMA (Bollinger Band midline) and recent consolidation highs. |
| $67.50 | $67.00 - $68.00 | Strong | Confluence of the 50-month SMA and the major structural breakout base formed from 2020-2023. |
| $37.50 | $37.00 - $38.00 | Strong | Long-term secular floor defined by the 200-month SMA. |
Resistance Price Levels
| Level | Range | Strength | Notes |
|---|---|---|---|
| $120.50 | $120.00 - $121.00 | Weak | Psychological round number and proximity to the upper Bollinger Band limit; otherwise in price discovery. |
Potential Chart Patterns in Formation
| Strength | Pattern | Signal | Target | Details |
|---|---|---|---|---|
| Strong | Secular Breakout & Parabolic Advance | Bullish | N/A | After a multi-year consolidation around the 50.00 level (2020-2023), the stock broke out and entered a steep, parabolic uptrend, riding the upper Bollinger Band. |
Frequently Asked Questions about WMT
What is the current sentiment for WMT?
The short-term sentiment for WMT is currently Bullish because Price is in a vertical ascent, trading near the upper Bollinger Band (120.12) with RSI > 80 confirming strong momentum.. The long-term trend is classified as Bullish.
What are the key support levels for WMT?
StockDips.AI has identified key support levels for WMT at $93.50 and $67.50. These levels may represent potential accumulation zones where buying interest could emerge.
Is WMT in a significant dip or a Value Dip right now?
WMT has a Value Score of 79/100. It is currently flagged as a significant dip in the Top Dips list. It is also listed as a Value Dip because long-term sentiment is bullish.
View the full interactive analysis on StockDips.AI.