AMD Monthly Technical Analysis
Advanced Micro Devices Inc.
Designs CPUs and GPUs for PCs and data centers competing with Intel and NVIDIA.
AMD Technical Analysis Summary
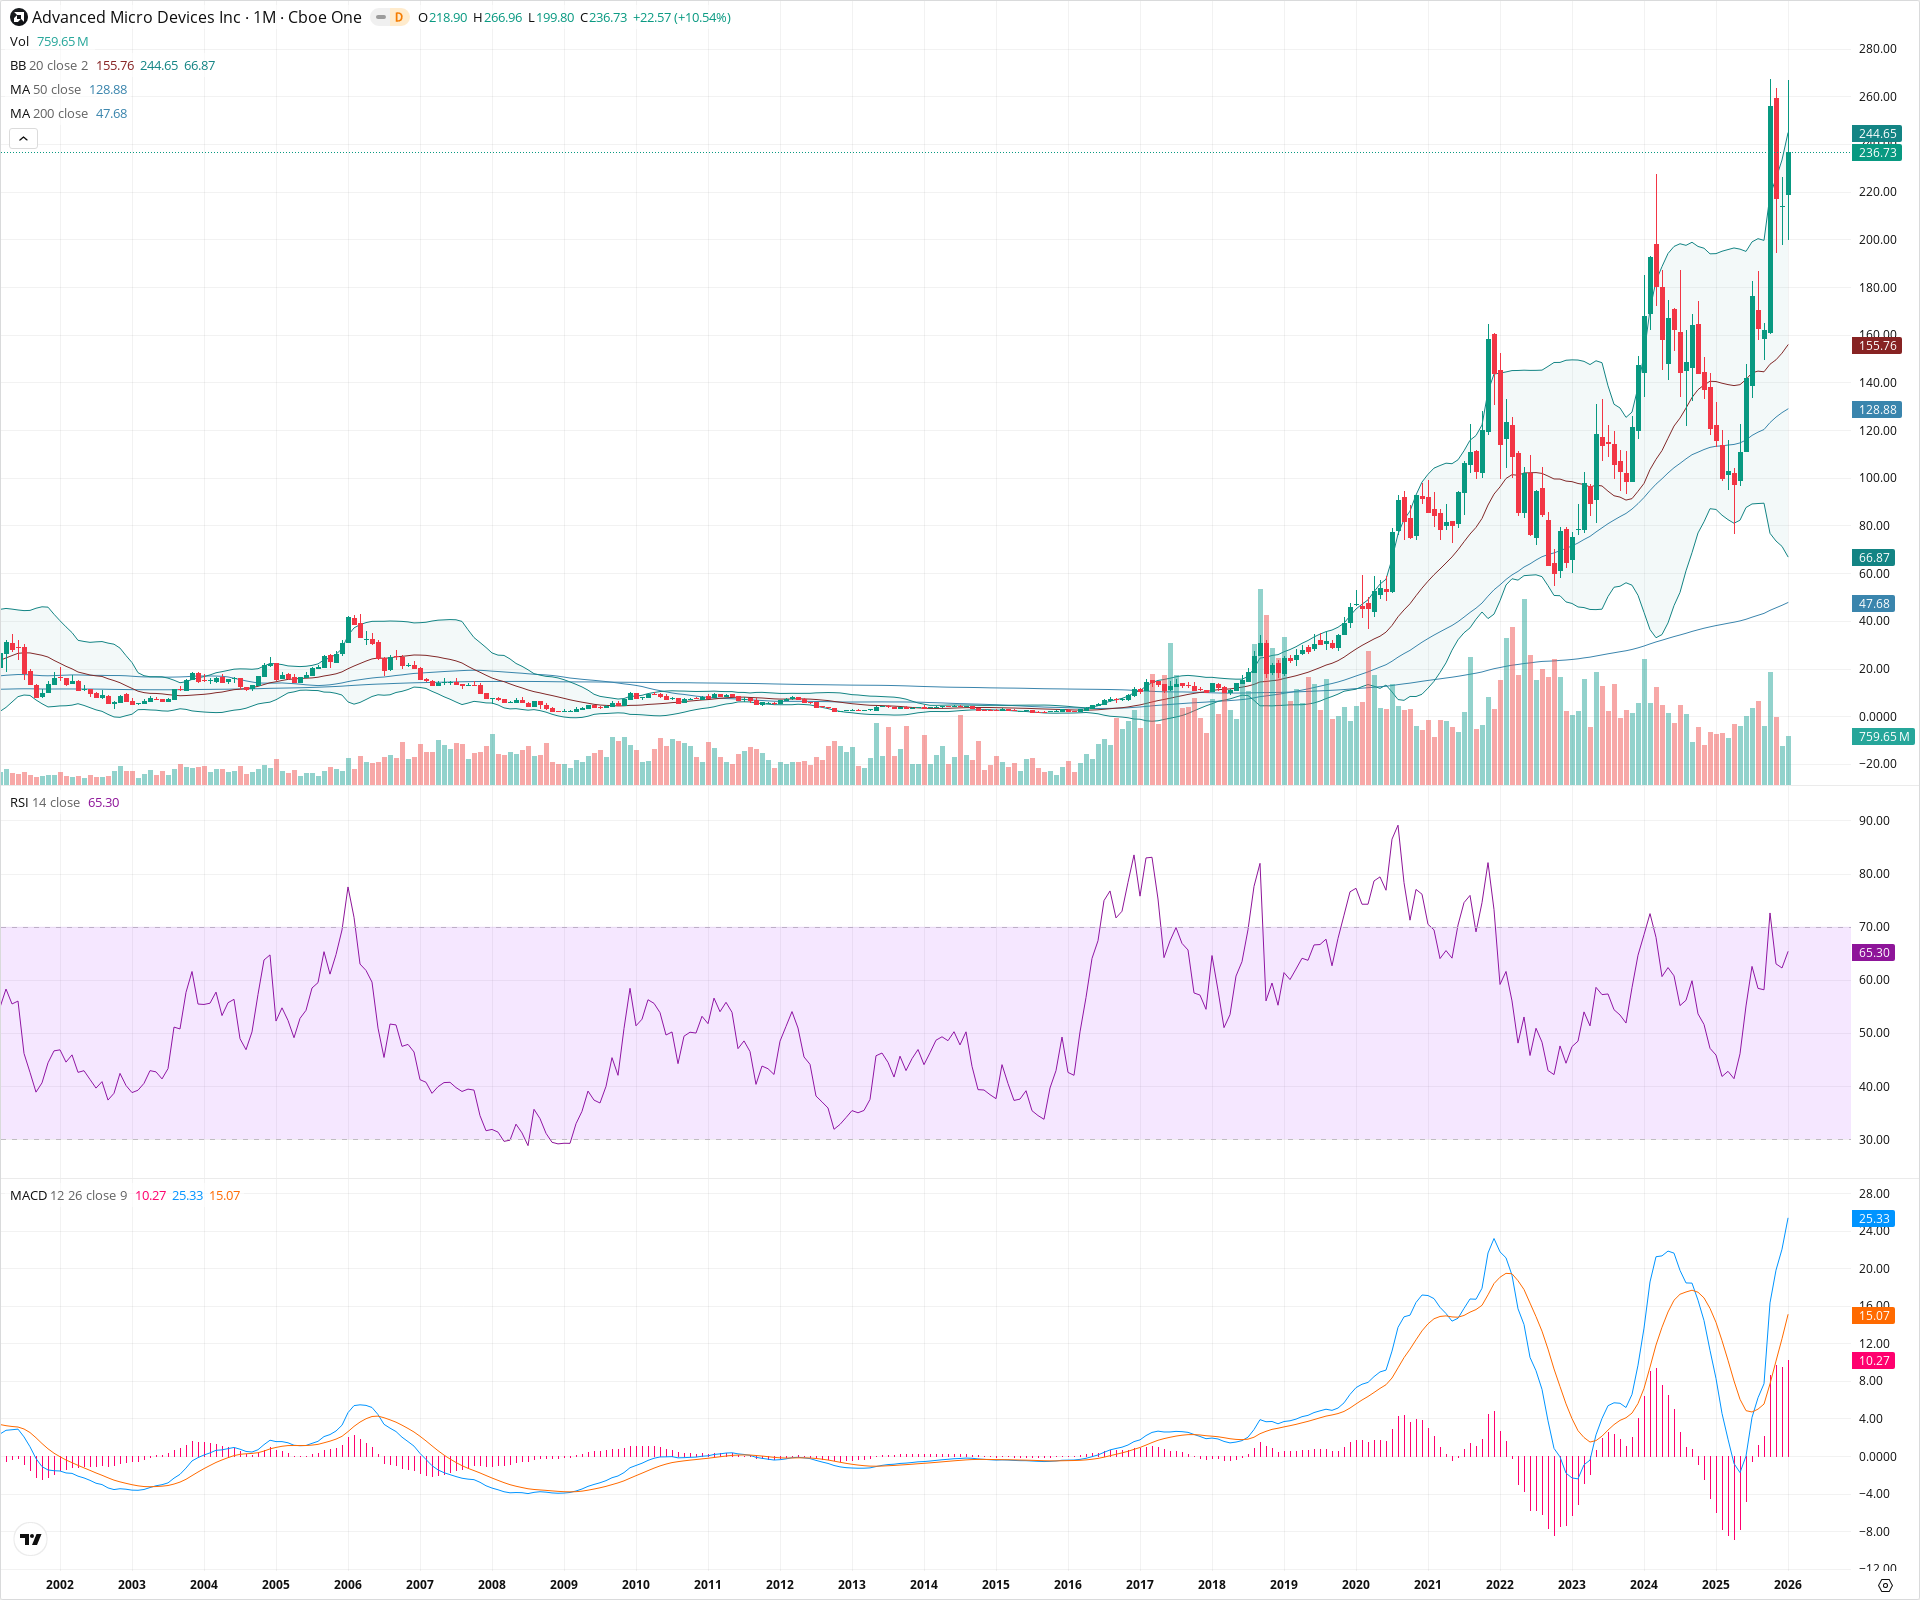
AMD is exhibiting a powerful long-term bullish trend, characterized by a decisive breakout above previous 2021 resistance into price discovery. Momentum is strong with the MACD expanding above the zero line and price action sustained above the upper Bollinger Band. Key structural support has been established at the breakout zone near 160, providing a solid floor for the current advance.
Included In Lists
Related Tickers of Interest
AMD Monthly Chart
Sentiment
Short-term Sentiment (days to weeks): Bullish
Price is aggressively trending upward in price discovery mode, riding the upper Bollinger Band with a positive and expanding MACD histogram.
Long-term Sentiment (weeks to months): Bullish
The stock is in a strong secular uptrend, confirmed by a breakout to new all-time highs after a multi-year consolidation. All major moving averages (20, 50, 200) are sloping upward and aligned in bullish order.
Report Metadata
- Timeframe: monthly
- Generated at: 2026-02-02T05:10:29.912Z
- Model: gemini-3-pro-preview
Support Price Levels
| Level | Range | Strength | Notes |
|---|---|---|---|
| $162.50 | $160.00 - $165.00 | Strong | Former all-time high from late 2021, which now acts as a major polarity support level after the recent breakout. |
| $131.50 | $128.00 - $135.00 | Strong | Confluence of the 50-month SMA and the rising 20-month SMA, representing a key trend-following support zone. |
| $57.50 | $55.00 - $60.00 | Strong | Major structural low established during the 2022 correction. |
Resistance Price Levels
| Level | Range | Strength | Notes |
|---|---|---|---|
| $266.96 | $266.96 - $266.96 | Weak | The current monthly high represents immediate resistance in price discovery. |
| $300.00 | $300.00 - $300.00 | Weak | Psychological round number resistance as the stock trades in uncharted territory. |
Potential Chart Patterns in Formation
| Strength | Pattern | Signal | Target | Details |
|---|---|---|---|---|
| Strong | Multi-Year Consolidation Breakout | Bullish | N/A | Price formed a large cup-like base from late 2021 to late 2023, successfully breaking out above the ~164 level to enter a new secular leg up. |
Frequently Asked Questions about AMD
What is the current sentiment for AMD?
The short-term sentiment for AMD is currently Bullish because Price is aggressively trending upward in price discovery mode, riding the upper Bollinger Band with a positive and expanding MACD histogram.. The long-term trend is classified as Bullish.
What are the key support levels for AMD?
StockDips.AI has identified key support levels for AMD at $162.50 and $131.50. These levels may represent potential accumulation zones where buying interest could emerge.
Is AMD in a significant dip or a Value Dip right now?
AMD has a Value Score of 61/100. It is not currently flagged as a significant dip in the Top Dips list. It is not listed as a Value Dip because the long-term sentiment or value-score threshold does not qualify.
View the full interactive analysis on StockDips.AI.