NVDA Daily Technical Analysis
NVIDIA Corporation
Designs GPUs and AI chips for gaming, data centers, and artificial intelligence systems.
NVDA Technical Analysis Summary
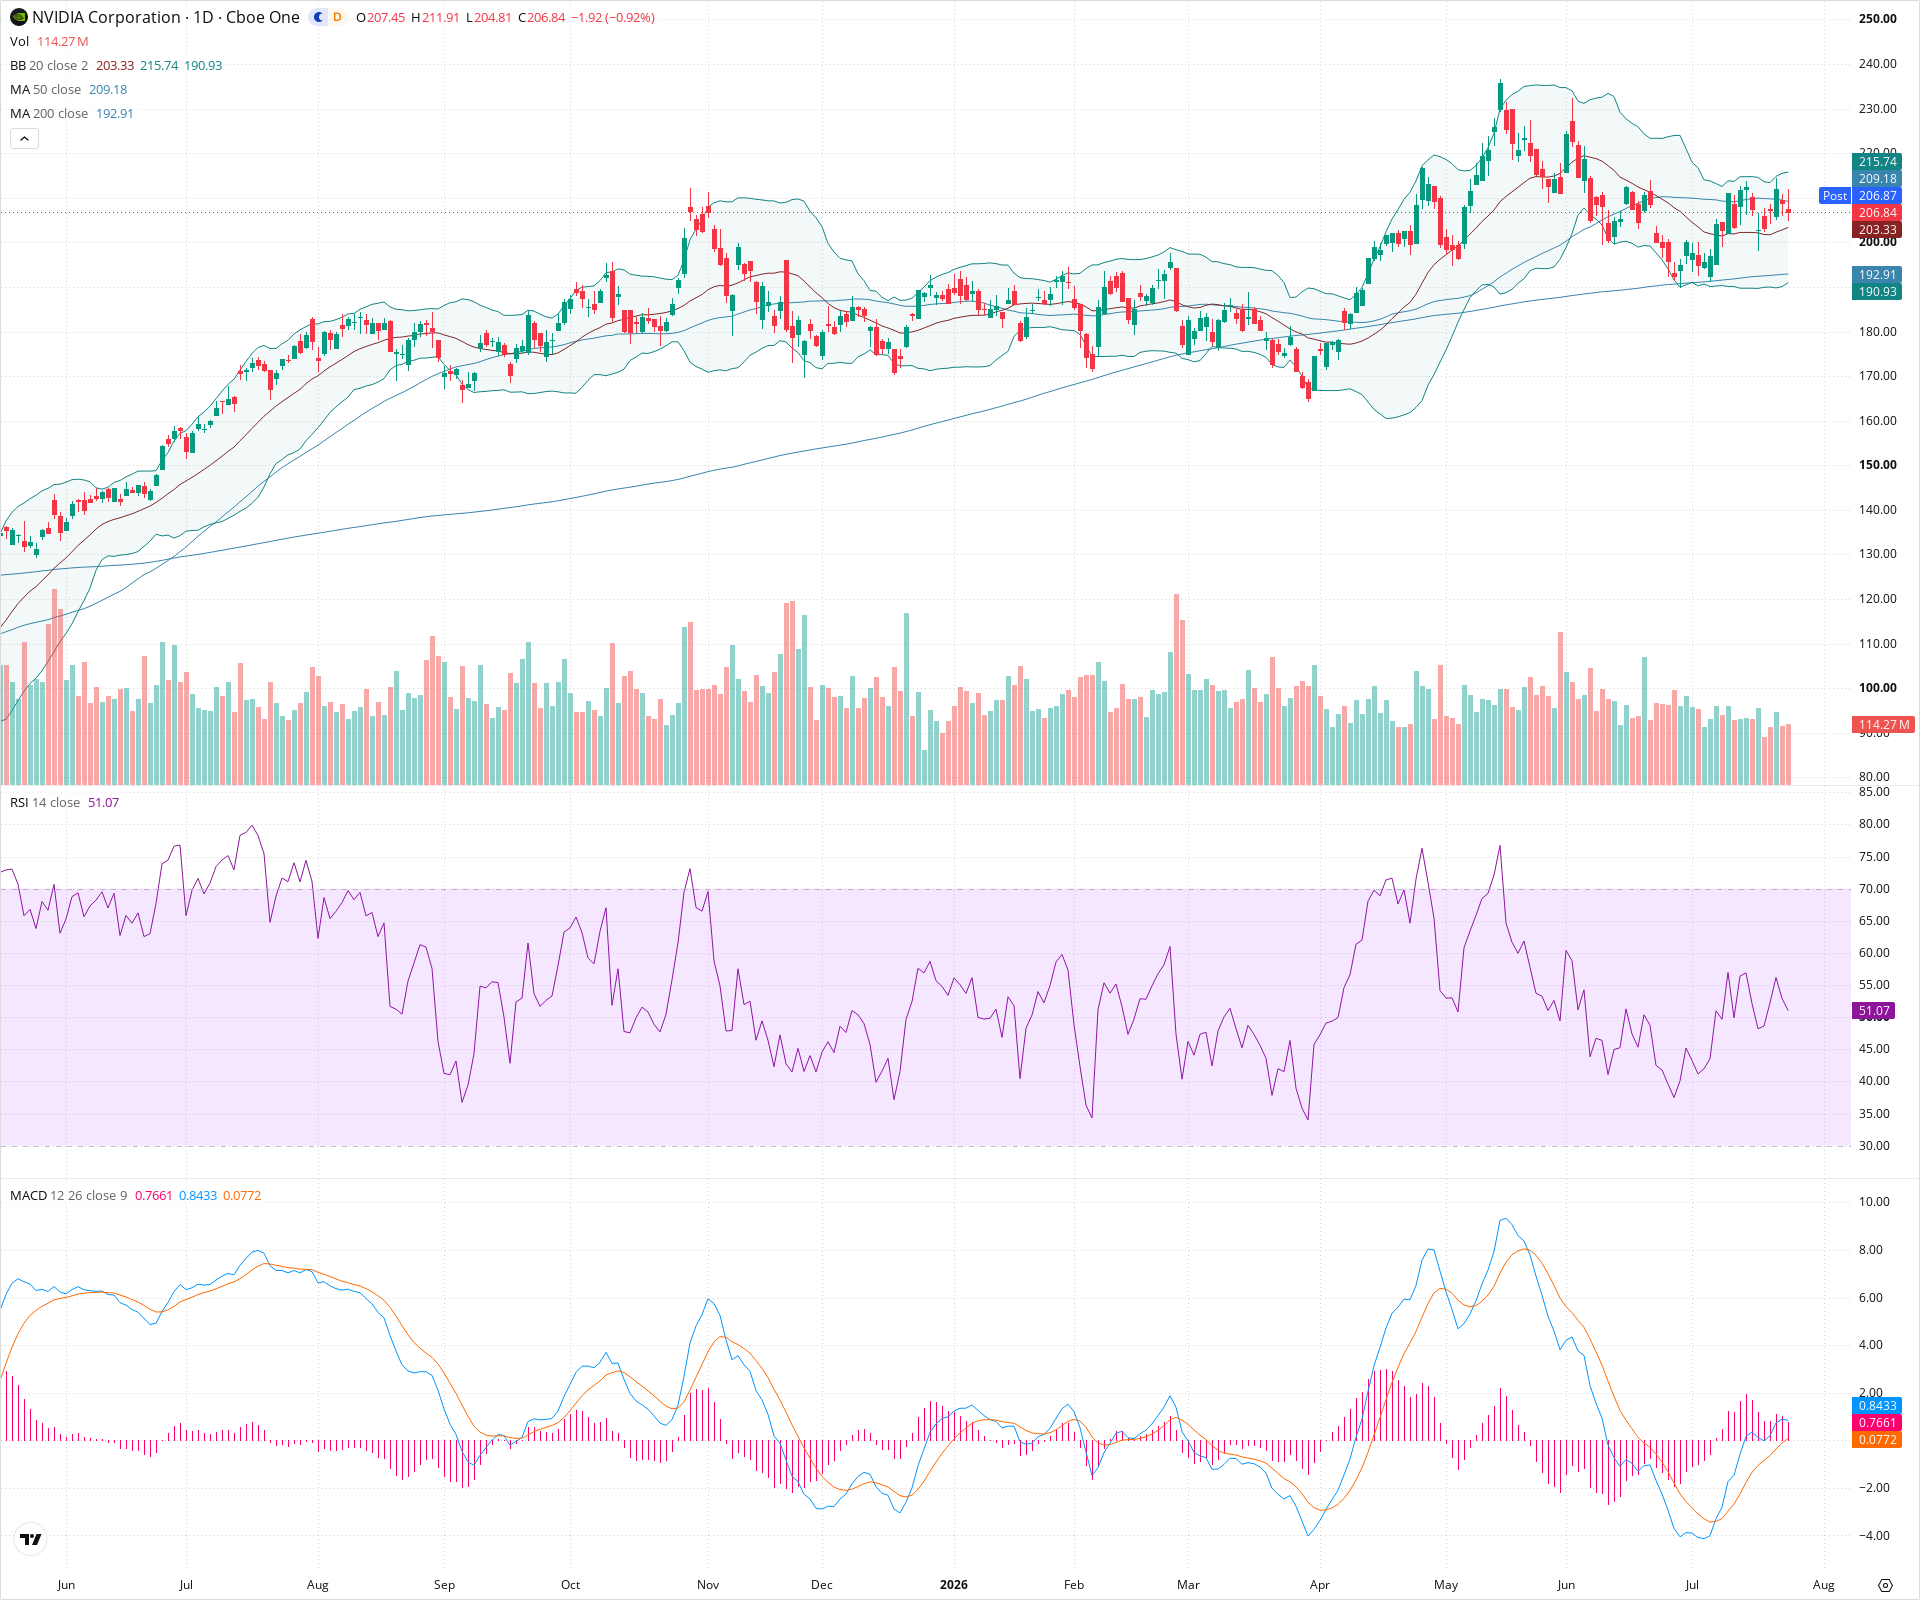
NVDA is currently in a period of short-term consolidation following a significant correction from its highs. It is trapped between the 20-day and 50-day moving averages, awaiting a decisive directional breakout. Long-term investors may view the structure favorably as the price remains above a rising 200-day SMA, but near-term caution is warranted until the 50-day SMA resistance is cleared.
Included In Lists
Related Tickers of Interest
NVDA Daily Chart
Sentiment
Short-term Sentiment (days to weeks): Neutral
Price is currently consolidating in a tight range, sandwiched between support at the 20-day SMA and resistance at the 50-day SMA. While a recent bullish MACD crossover suggests building momentum, RSI is flat near 50, indicating indecision.
Long-term Sentiment (weeks to months): Bullish
The broader trend remains intact as the price is trading well above a positively sloping 200-day SMA. The recent large pullback appears to be a correction within a larger macro uptrend.
Report Metadata
- Timeframe: daily
- Generated at: 2026-07-24T21:01:43.899Z
- Model: gemini-3.1-pro-preview
Support Price Levels
| Level | Range | Strength | Notes |
|---|---|---|---|
| $202.00 | $200.00 - $204.00 | Strong | Zone encompassing the rising 20-day SMA, recent swing lows, and the psychological 200 level. |
| $191.50 | $190.00 - $193.00 | Strong | Major structural support zone aligning with the 200-day SMA and previous significant swing lows from earlier in the year. |
Resistance Price Levels
| Level | Range | Strength | Notes |
|---|---|---|---|
| $212.00 | $209.00 - $215.00 | Strong | Immediate overhead resistance zone formed by the descending 50-day SMA and recent local swing highs/wicks. |
| $232.50 | $230.00 - $235.00 | Strong | Previous major swing high zone; represents significant historical supply. |
Potential Chart Patterns in Formation
| Strength | Pattern | Signal | Target | Details |
|---|---|---|---|---|
| Weak | Symmetrical Triangle / Consolidation Wedge | Neutral | N/A | Price action over the past month is coiling, forming lower highs and higher lows, indicating a volatility contraction between the 20-day and 50-day moving averages. |
Frequently Asked Questions about NVDA
What is the current sentiment for NVDA?
The short-term sentiment for NVDA is currently Neutral because Price is currently consolidating in a tight range, sandwiched between support at the 20-day SMA and resistance at the 50-day SMA. While a recent bullish MACD crossover suggests building momentum, RSI is flat near 50, indicating indecision.. The long-term trend is classified as Bullish.
What are the key support levels for NVDA?
StockDips.AI has identified key support levels for NVDA at $202.00 and $191.50. These levels may represent potential accumulation zones where buying interest could emerge.
Is NVDA in a significant dip or a Value Dip right now?
NVDA has a Value Score of 52/100. It is not currently flagged as a significant dip in the Top Dips list. It is not listed as a Value Dip because the long-term sentiment or value-score threshold does not qualify.
View the full interactive analysis on StockDips.AI.