AVGO Monthly Technical Analysis
Broadcom Inc
Designs semiconductors and enterprise software following its VMware acquisition.
AVGO Technical Analysis Summary
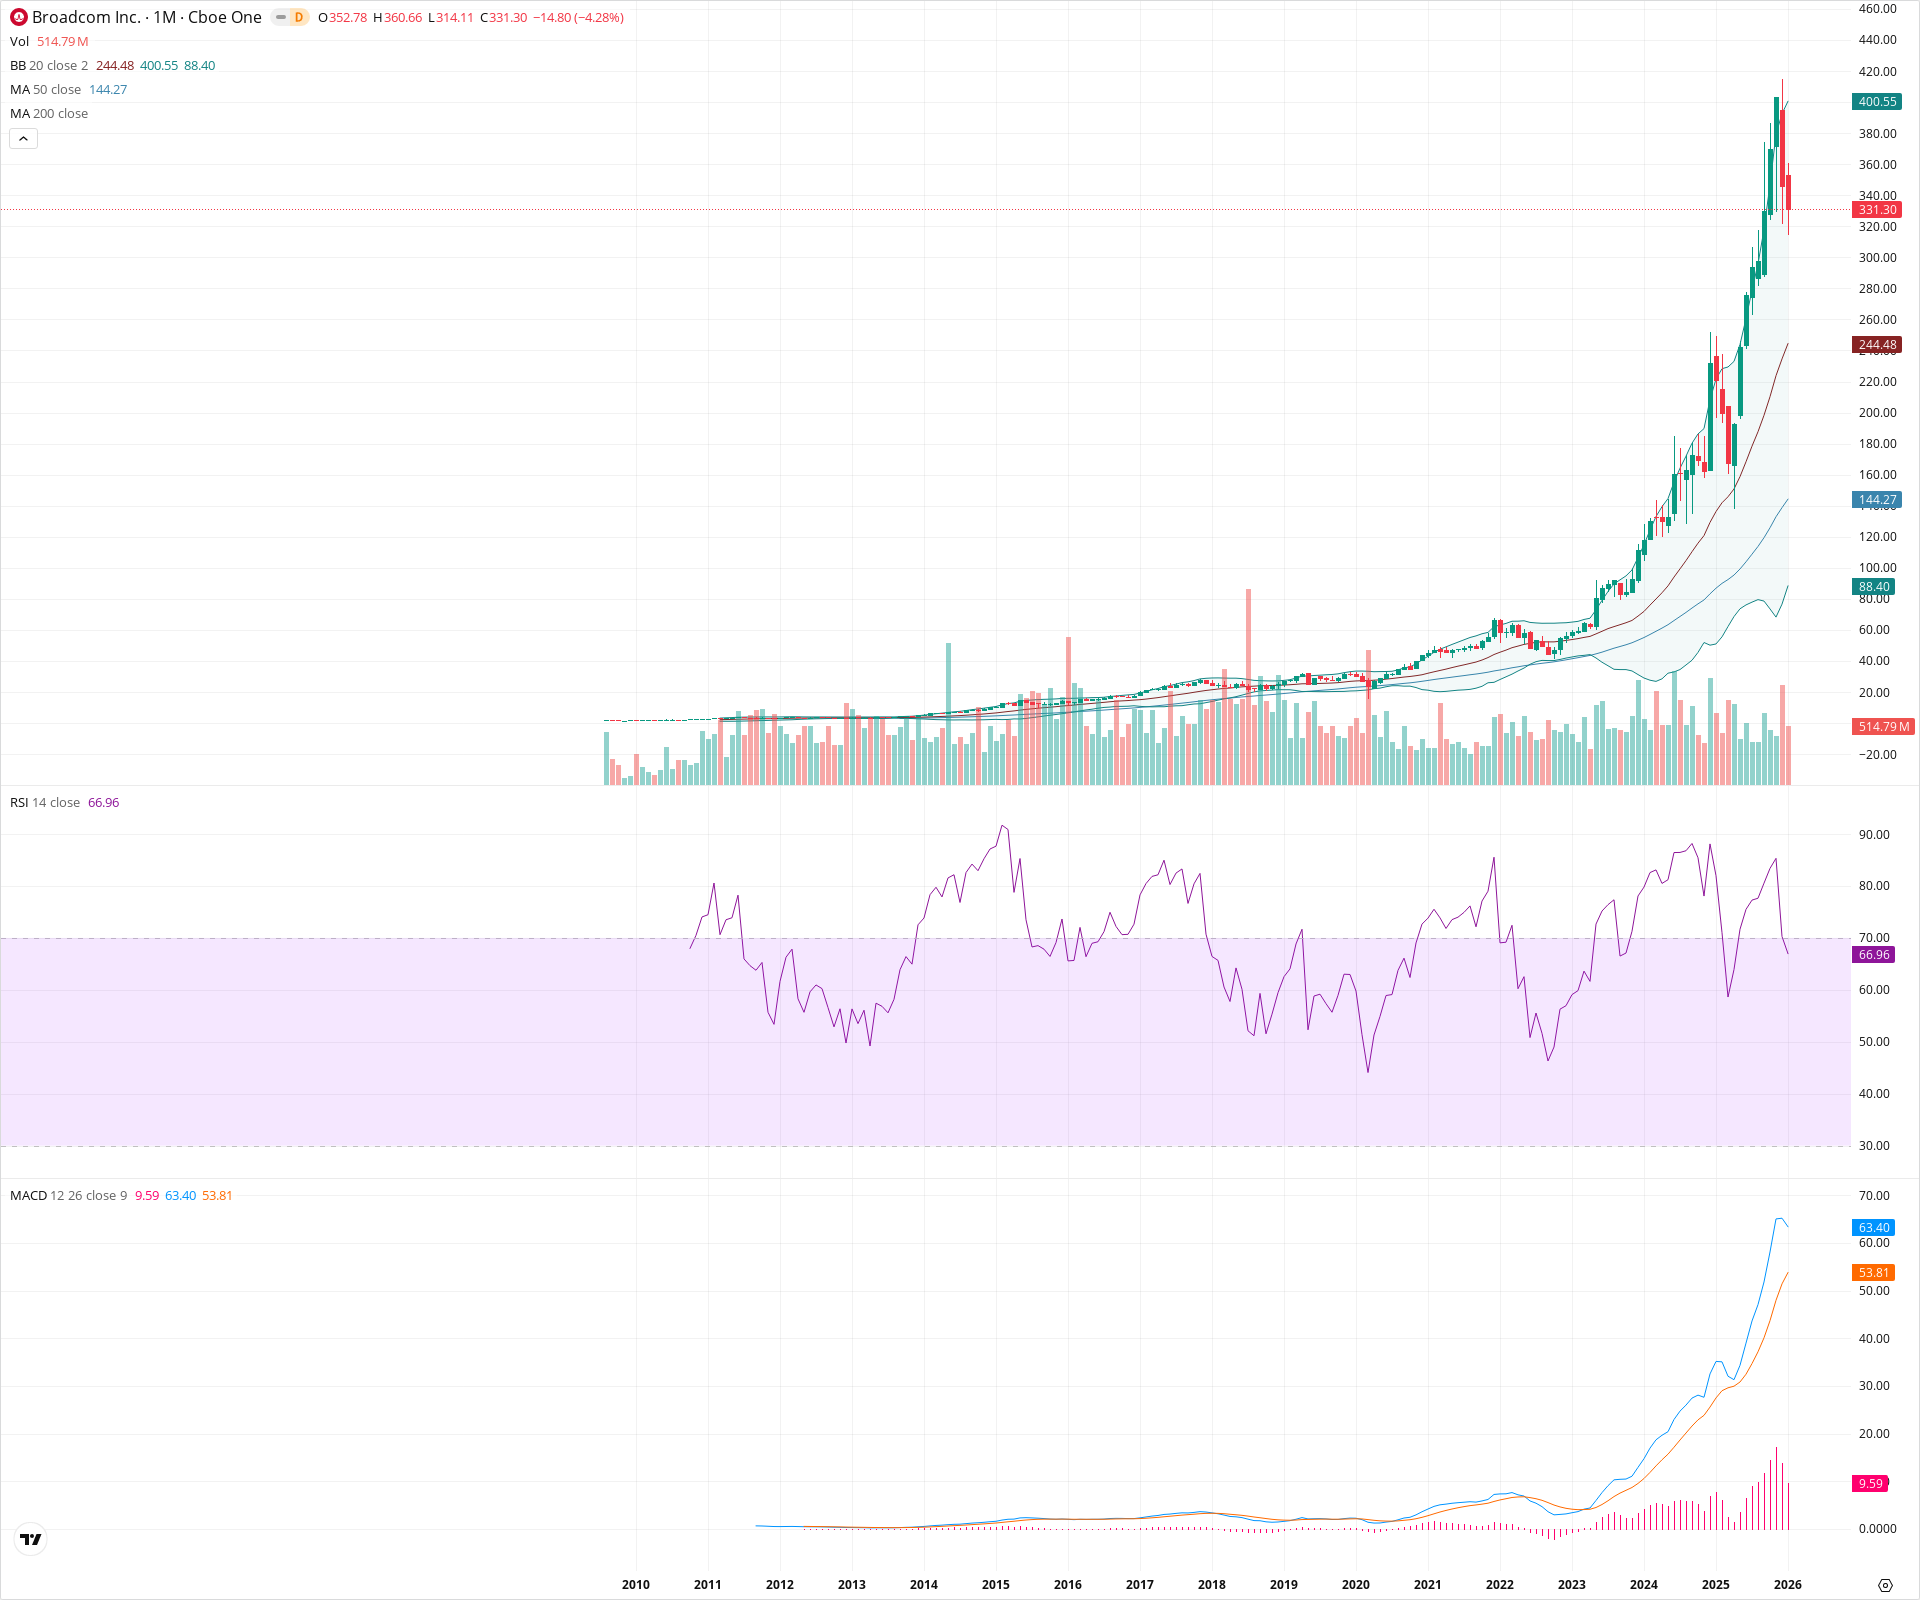
Broadcom (AVGO) is in a powerful secular bull market, evidenced by a steep parabolic rally that has extended significantly above all major moving averages. While the long-term momentum is robust with MACD confirming the trend, the current month shows a corrective pullback from all-time highs, suggesting a potential pause to digest gains. Investors should watch the 20-month SMA near 245 as a critical dynamic support level if the consolidation deepens. The overall structure remains highly constructive unless key support levels are violated.
Included In Lists
Related Tickers of Interest
AVGO Monthly Chart
Sentiment
Short-term Sentiment (days to weeks): Neutral
The stock is currently experiencing a pullback (down ~4.28% for the month) after hitting a fresh all-time high of ~360. While the primary trend is up, the current red candle suggests a period of consolidation or profit-taking is underway.
Long-term Sentiment (weeks to months): Bullish
The long-term trend is exceptionally strong, characterized by a parabolic advance well above rising 20, 50, and 200-month SMAs. The MACD is in a strong bullish expansion, and the RSI remains in a bullish regime above 60.
Report Metadata
- Timeframe: monthly
- Generated at: 2026-02-02T05:11:39.910Z
- Model: gemini-3-pro-preview
Support Price Levels
| Level | Range | Strength | Notes |
|---|---|---|---|
| $245.00 | $240.00 - $250.00 | Strong | Coincides with the 20-month SMA (Bollinger Band midline), serving as the primary dynamic support for the long-term trend. |
| $185.00 | $180.00 - $190.00 | Strong | Major structural breakout zone from the 2021-2023 consolidation phase. |
Resistance Price Levels
| Level | Range | Strength | Notes |
|---|---|---|---|
| $362.50 | $360.00 - $365.00 | Strong | Current all-time high established in the most recent candle. |
| $402.50 | $400.00 - $405.00 | Weak | Upper Bollinger Band level, acting as a potential volatility ceiling. |
Potential Chart Patterns in Formation
| Strength | Pattern | Signal | Target | Details |
|---|---|---|---|---|
| Strong | Parabolic Uptrend | Bullish | N/A | Price has accelerated vertically away from moving averages since breaking out in late 2023, typical of a climax run or extremely strong momentum phase. |
Frequently Asked Questions about AVGO
What is the current sentiment for AVGO?
The short-term sentiment for AVGO is currently Neutral because The stock is currently experiencing a pullback (down ~4.28% for the month) after hitting a fresh all-time high of ~360. While the primary trend is up, the current red candle suggests a period of consolidation or profit-taking is underway.. The long-term trend is classified as Bullish.
What are the key support levels for AVGO?
StockDips.AI has identified key support levels for AVGO at $245.00 and $185.00. These levels may represent potential accumulation zones where buying interest could emerge.
Is AVGO in a significant dip or a Value Dip right now?
AVGO has a Value Score of 48/100. It is not currently flagged as a significant dip in the Top Dips list. It is not listed as a Value Dip because the long-term sentiment or value-score threshold does not qualify.
View the full interactive analysis on StockDips.AI.