BMNR Weekly Technical Analysis
BitMine Immersion Technologies Inc
Developer of immersion cooling technology for crypto mining equipment.
BMNR Technical Analysis Summary
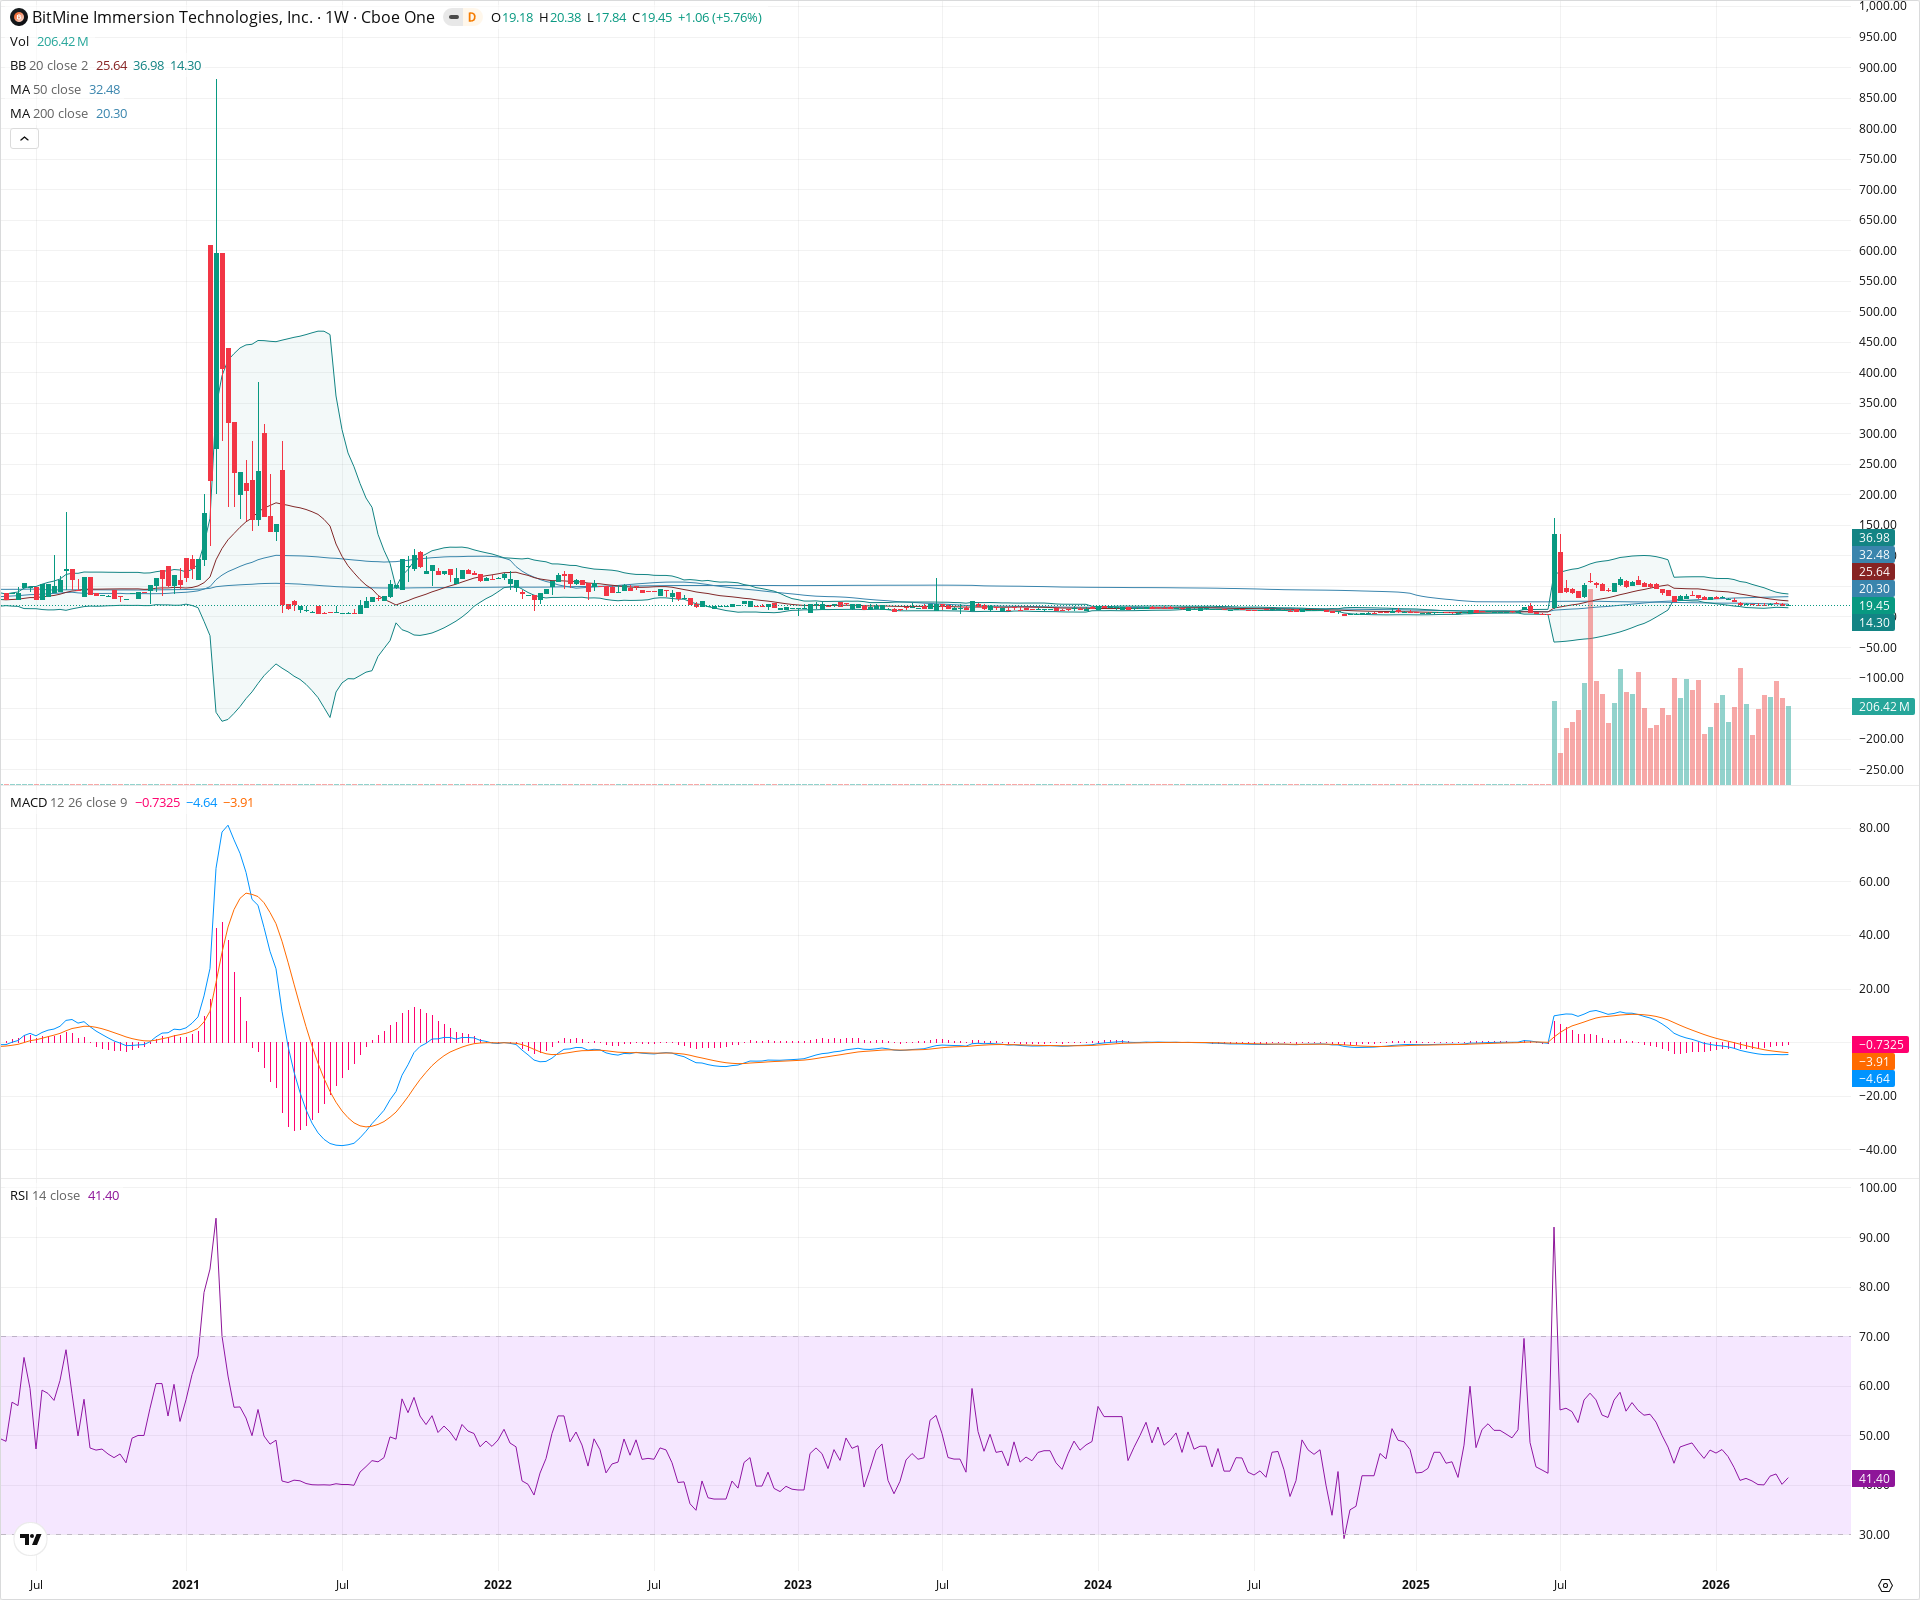
BMNR exhibits a highly volatile chart history defined by massive, unsustainable spikes followed by deep crashes. Currently, the stock is in a confirmed downtrend following its most recent surge, having broken below both the 50-week and 200-week SMAs. Technical momentum indicators remain negative, suggesting further downside or prolonged consolidation is likely before any new base can form.
Included In Lists
Related Tickers of Interest
BMNR Weekly Chart
Sentiment
Short-term Sentiment (days to weeks): Bearish
Price is trading below key moving averages, RSI is below 50 and declining, and MACD shows negative momentum with the histogram expanding downwards.
Long-term Sentiment (weeks to months): Bearish
The long-term structure shows a massive speculative spike followed by a deep retracement. Price has recently fallen below the 200-week SMA, indicating a loss of major long-term support.
Report Metadata
- Timeframe: weekly
- Generated at: 2026-04-04T09:15:42.032Z
- Model: gemini-3.1-pro-preview
Support Price Levels
| Level | Range | Strength | Notes |
|---|---|---|---|
| $15.50 | $14.00 - $17.00 | Weak | Recent minor consolidation lows and proximity to the lower Bollinger Band (14.30). |
| $5.00 | $2.00 - $8.00 | Strong | Historical base level where the stock traded for a prolonged period prior to the recent massive price spike. |
Resistance Price Levels
| Level | Range | Strength | Notes |
|---|---|---|---|
| $21.00 | $20.00 - $22.00 | Moderate | Immediate overhead resistance near the 200-week SMA (20.30). |
| $26.50 | $25.00 - $28.00 | Strong | Confluence of prior price congestion and the 20-week SMA (middle Bollinger Band at 25.64). |
| $33.50 | $32.00 - $35.00 | Strong | Significant overhead resistance marked by the declining 50-week SMA (32.48). |
Potential Chart Patterns in Formation
| Strength | Pattern | Signal | Target | Details |
|---|---|---|---|---|
| Strong | Post-Spike Retracement | Bearish | N/A | Following an extreme vertical price surge, the stock is in a steady, multi-month downtrend, failing to establish higher highs and breaking key support levels. |
Frequently Asked Questions about BMNR
What is the current sentiment for BMNR?
The short-term sentiment for BMNR is currently Bearish because Price is trading below key moving averages, RSI is below 50 and declining, and MACD shows negative momentum with the histogram expanding downwards.. The long-term trend is classified as Bearish.
What are the key support levels for BMNR?
StockDips.AI has identified key support levels for BMNR at $15.50 and $5.00. These levels may represent potential accumulation zones where buying interest could emerge.
Is BMNR in a significant dip or a Value Dip right now?
BMNR has a Value Score of 288/100. It is not currently flagged as a significant dip in the Top Dips list. It is not listed as a Value Dip because the long-term sentiment or value-score threshold does not qualify.
View the full interactive analysis on StockDips.AI.