COIN Daily Technical Analysis
Coinbase Global Inc
Cryptocurrency exchange offering trading, custody, and blockchain services.
COIN Technical Analysis Summary
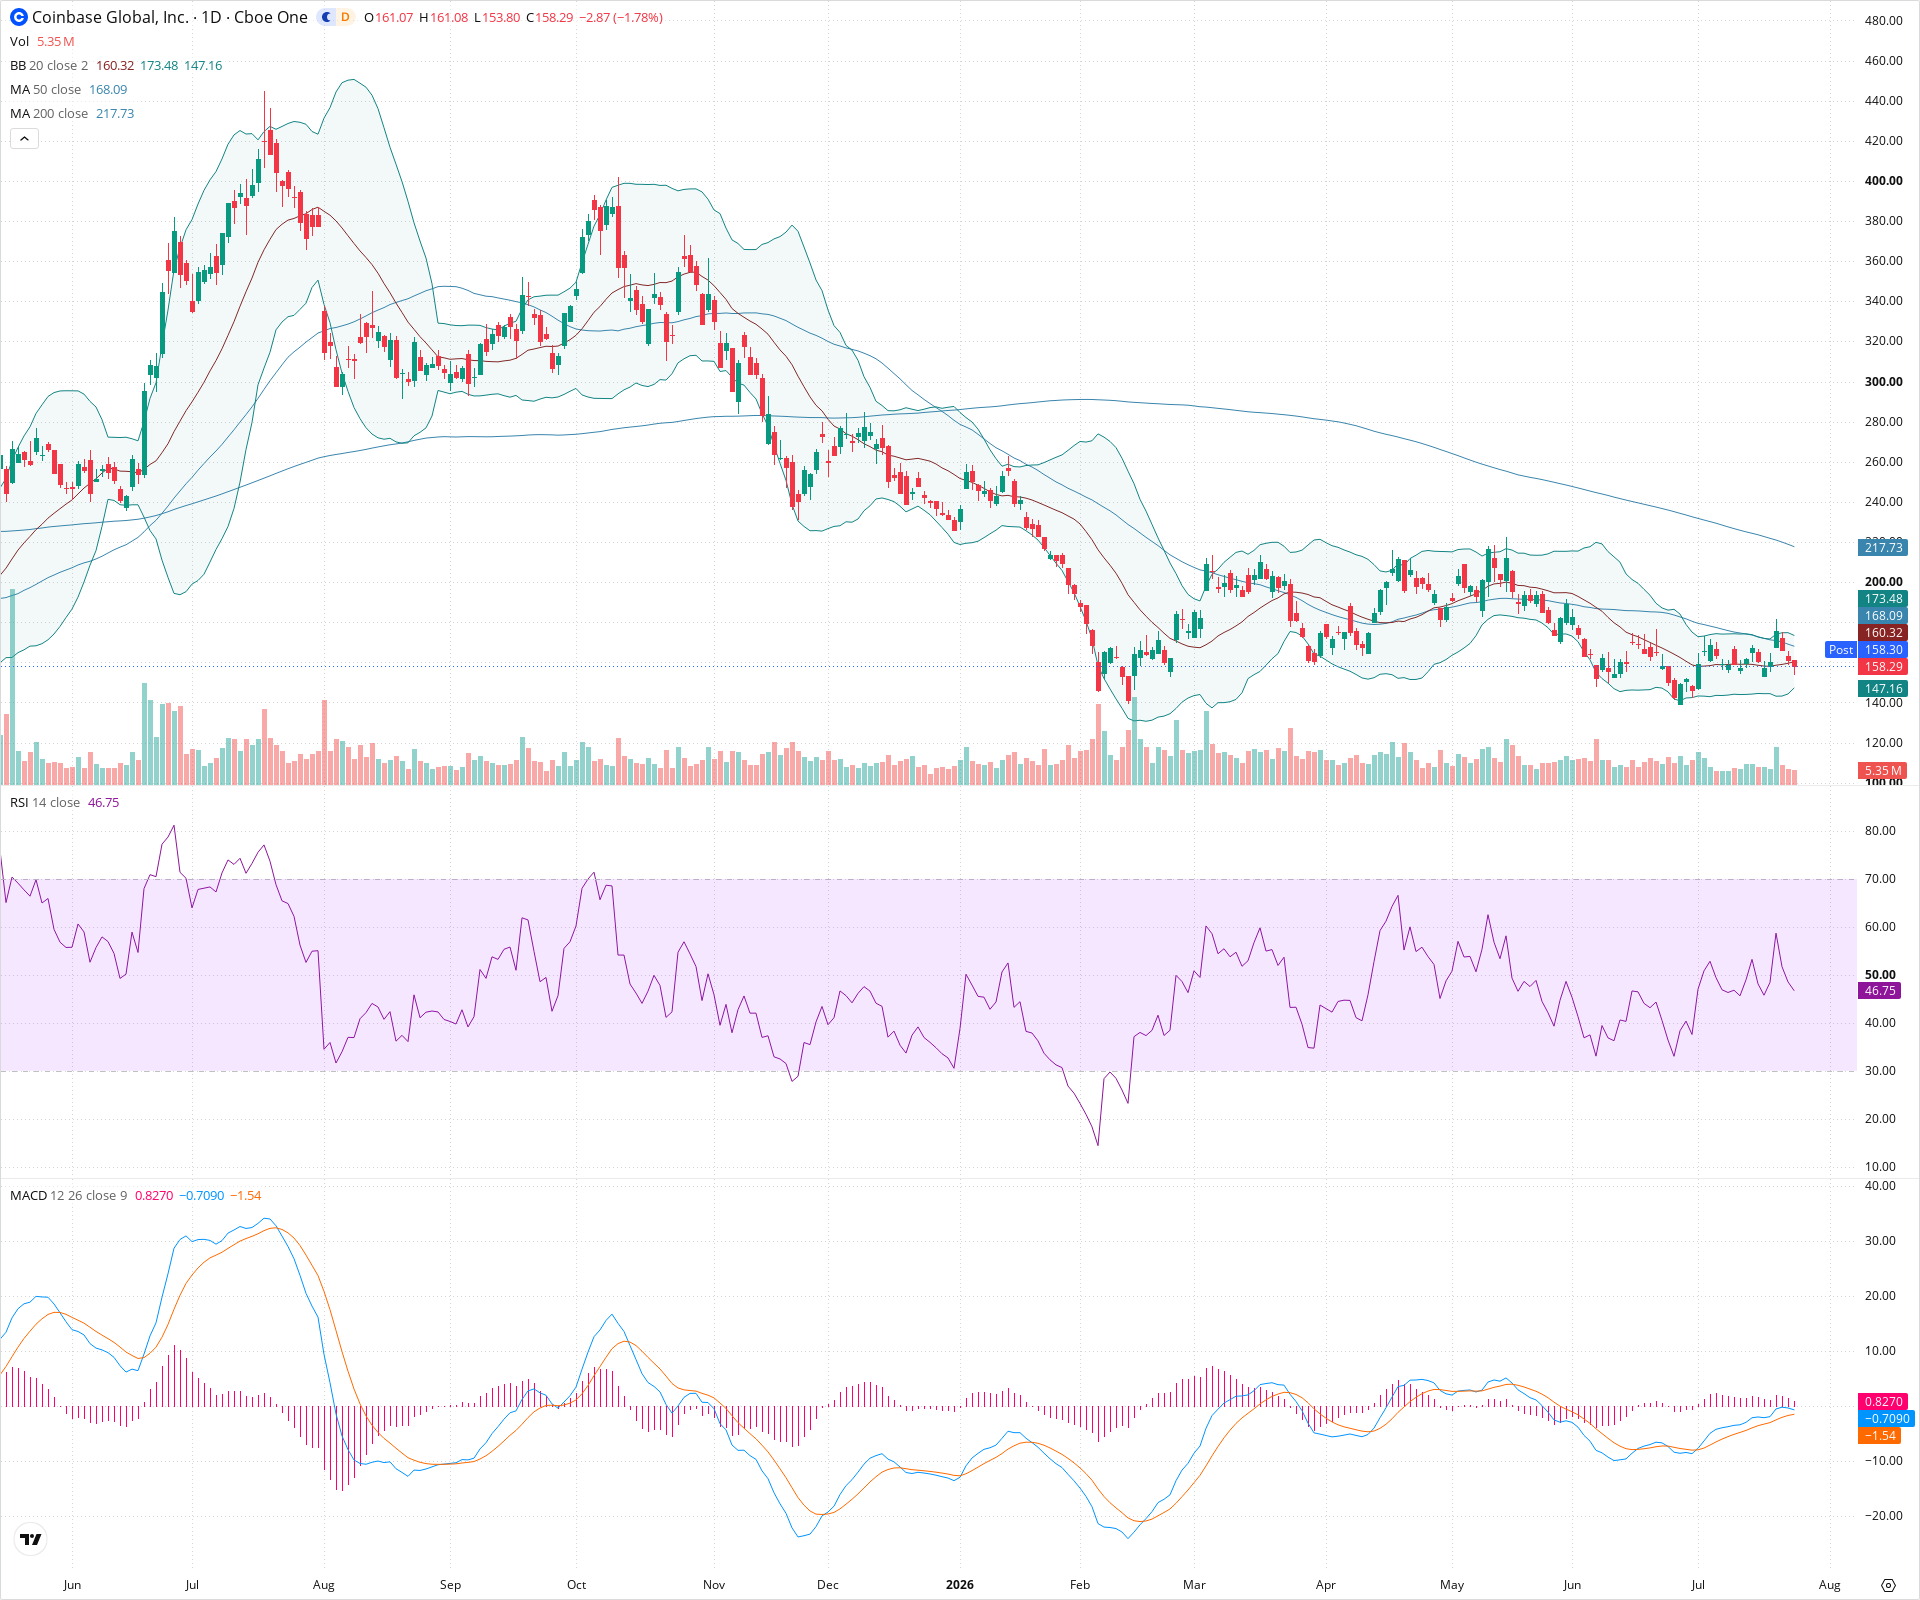
COIN remains firmly entrenched in a long-term downtrend, trading well below its major 50-day and 200-day moving averages. Currently, the stock is in a neutral, sideways consolidation phase, effectively pausing the bearish momentum as confirmed by a flattening RSI and mildly recovering but negative MACD. A break above the $175 level and the 50-day SMA is required to shift short-term sentiment, while a breakdown below $140 would suggest a resumption of the primary bearish trend.
Included In Lists
Related Tickers of Interest
COIN Daily Chart
Sentiment
Short-term Sentiment (days to weeks): Neutral
Price is trading in a sideways consolidation range near the 20-day SMA. RSI is flat around the 46 level, and while MACD shows a bullish crossover, it remains in negative territory, indicating a pause in momentum rather than a confirmed reversal.
Long-term Sentiment (weeks to months): Bearish
The dominant trend remains firmly downward, with price trading significantly below both a declining 50-day SMA and 200-day SMA. A historical 'Death Cross' (50 SMA crossing below 200 SMA) continues to dictate the broader trend.
Report Metadata
- Timeframe: daily
- Generated at: 2026-07-24T21:09:36.298Z
- Model: gemini-3.1-pro-preview
Support Price Levels
| Level | Range | Strength | Notes |
|---|---|---|---|
| $143.50 | $140.00 - $147.00 | Strong | Recent horizontal consolidation floor and multiple swing lows from June and July. |
| $115.00 | $110.00 - $120.00 | Weak | Estimated structural support from prior significant dips visible on the extreme left of the chart. |
Resistance Price Levels
| Level | Range | Strength | Notes |
|---|---|---|---|
| $171.50 | $168.00 - $175.00 | Strong | Current top of the consolidation channel, heavily reinforced by the declining 50-day SMA (168.09). |
| $205.00 | $200.00 - $210.00 | Strong | Major swing high resistance cluster from May/June before the most recent leg down. |
| $218.50 | $217.00 - $220.00 | Strong | The 200-day Simple Moving Average, representing major long-term dynamic resistance. |
Potential Chart Patterns in Formation
| Strength | Pattern | Signal | Target | Details |
|---|---|---|---|---|
| Strong | Rectangle Consolidation / Potential Bear Flag | Bearish | N/A | Following a sharp downtrend, price is moving sideways in a defined channel between roughly 145 and 175, which often acts as a continuation pattern to the downside. |
Frequently Asked Questions about COIN
What is the current sentiment for COIN?
The short-term sentiment for COIN is currently Neutral because Price is trading in a sideways consolidation range near the 20-day SMA. RSI is flat around the 46 level, and while MACD shows a bullish crossover, it remains in negative territory, indicating a pause in momentum rather than a confirmed reversal.. The long-term trend is classified as Bearish.
What are the key support levels for COIN?
StockDips.AI has identified key support levels for COIN at $143.50 and $115.00. These levels may represent potential accumulation zones where buying interest could emerge.
Is COIN in a significant dip or a Value Dip right now?
COIN has a Value Score of 47/100. It is not currently flagged as a significant dip in the Top Dips list. It is not listed as a Value Dip because the long-term sentiment or value-score threshold does not qualify.
View the full interactive analysis on StockDips.AI.