HOOD Daily Technical Analysis
Robinhood Markets Inc
Retail brokerage app offering commission-free stock, options, and crypto trading.
HOOD Technical Analysis Summary
The technical picture for HOOD has deteriorated significantly following a breakdown from a likely Head and Shoulders topping pattern. The decisive break below both the 50-day and 200-day moving averages on high volume signals a strong shift in momentum to the downside. Long-term investors should exercise caution as structural support levels are tested, with momentum indicators like MACD and RSI confirming the current bearish trend.
Included In Lists
Related Tickers of Interest
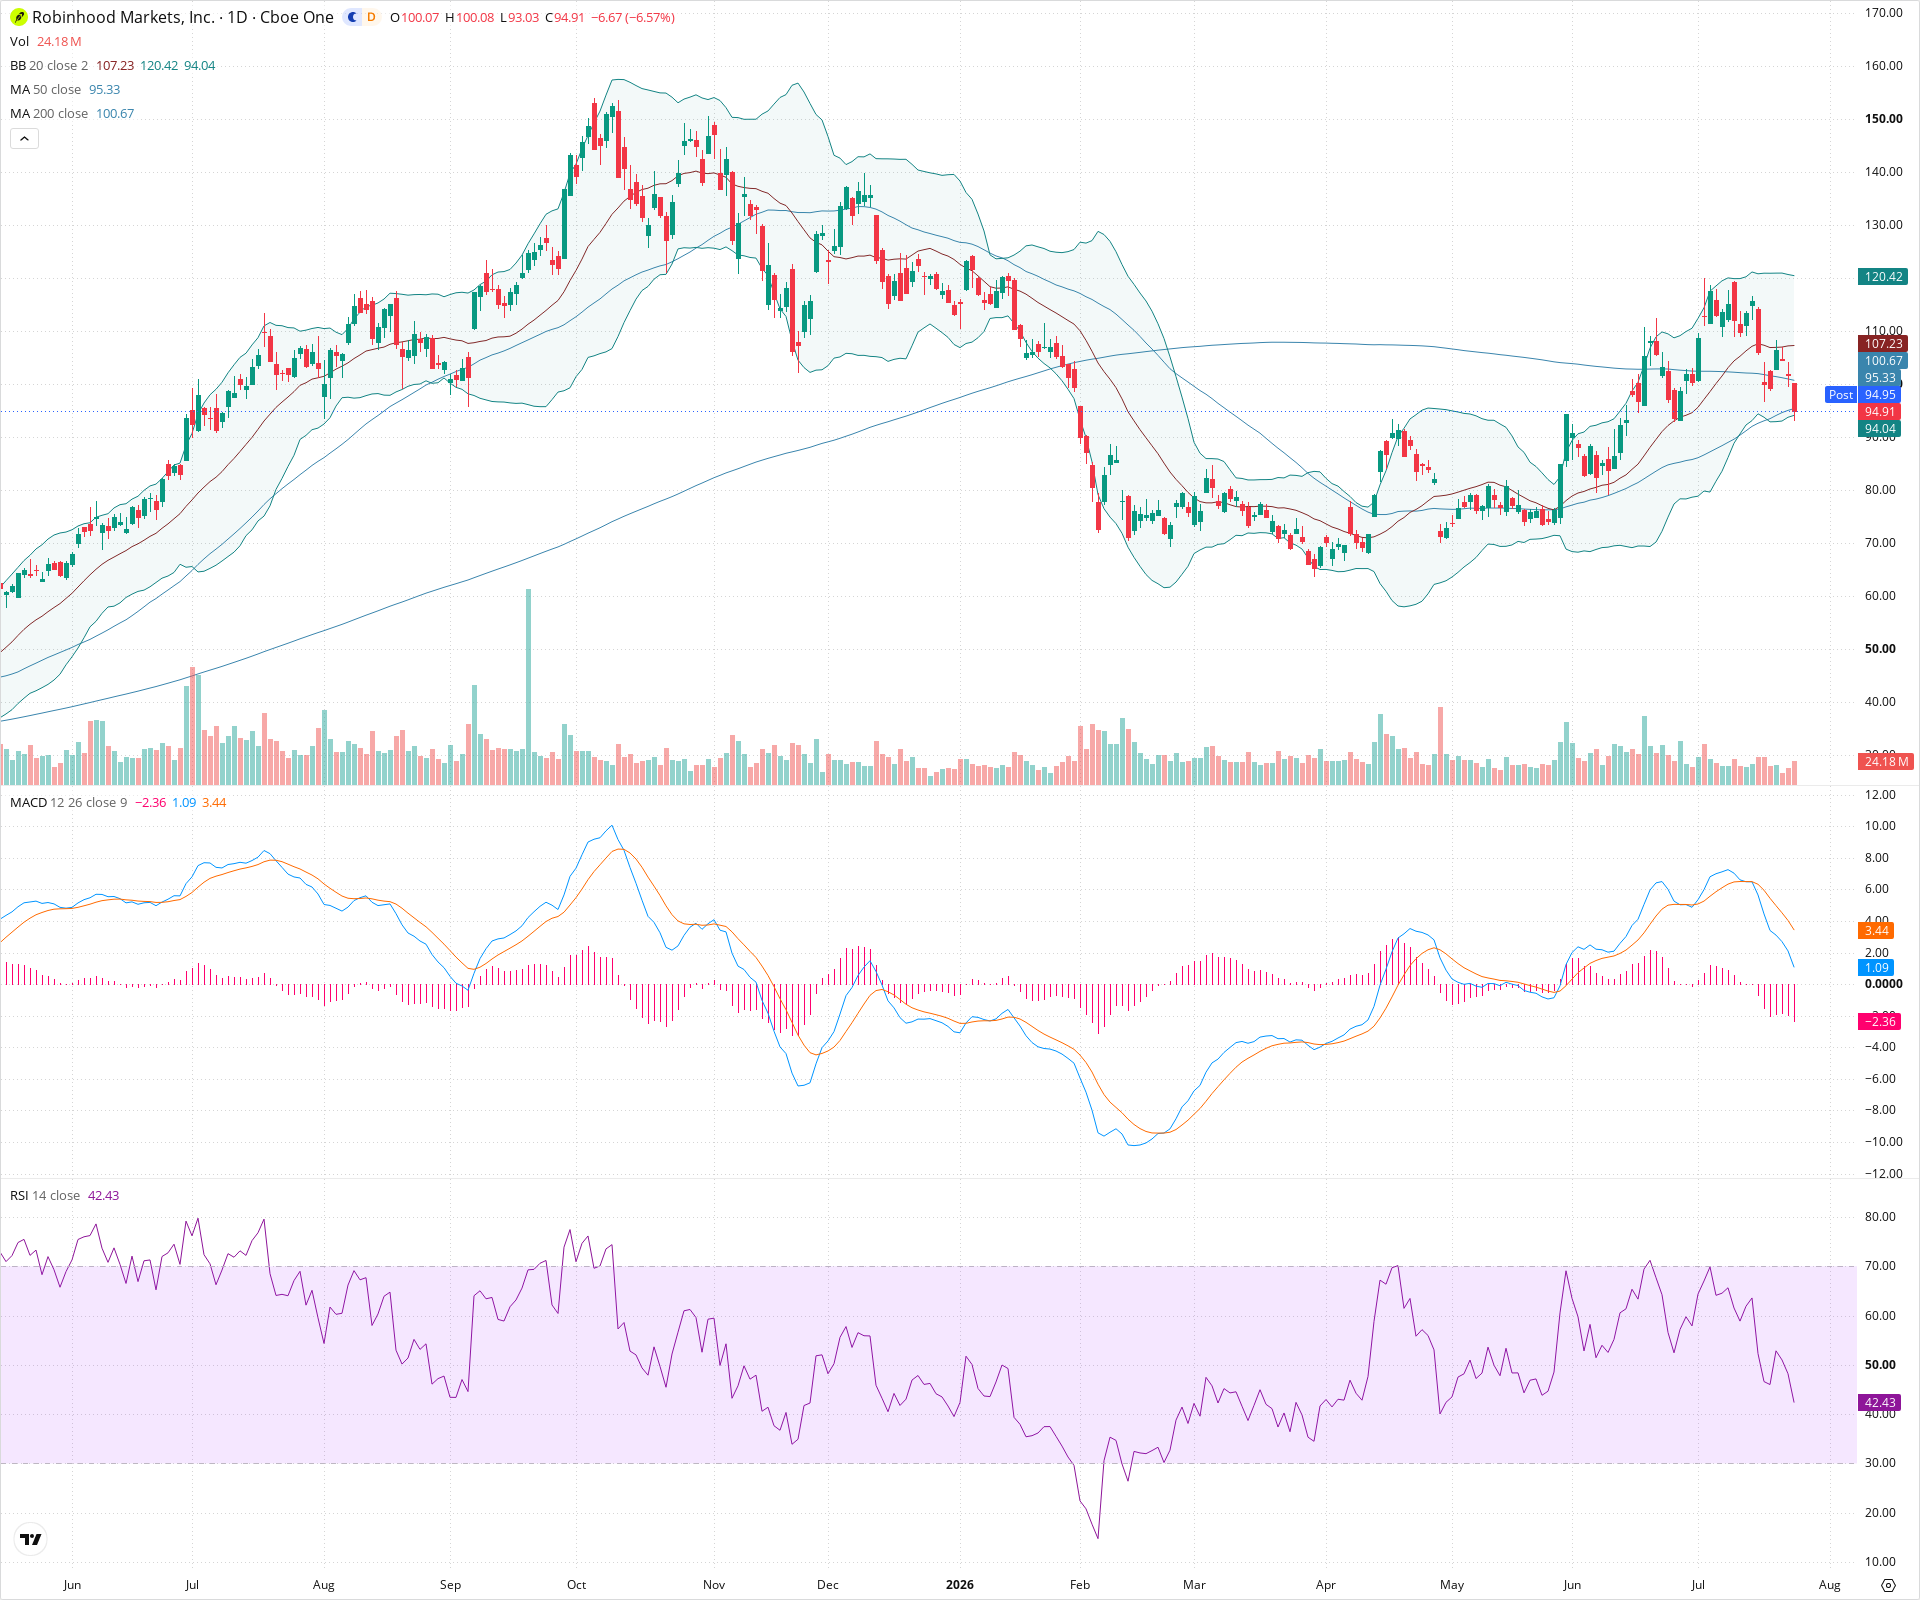
HOOD Daily Chart
Sentiment
Short-term Sentiment (days to weeks): Bearish
Price has sharply broken down below recent consolidation, the 50-day SMA, and the 200-day SMA on elevated volume. MACD has crossed bearishly with an expanding negative histogram, and RSI is pointing steeply downward.
Long-term Sentiment (weeks to months): Bearish
The price has decisively broken below the 200-day moving average, a key long-term trend indicator. Additionally, the 50-day SMA is positioned below the 200-day SMA, confirming a broader structural weakness and potential trend reversal.
Report Metadata
- Timeframe: daily
- Generated at: 2026-07-24T21:10:53.399Z
- Model: gemini-3.1-pro-preview
Support Price Levels
| Level | Range | Strength | Notes |
|---|---|---|---|
| $93.75 | $93.00 - $94.50 | Weak | Immediate dynamic support at the lower Bollinger Band and today's session low. |
| $82.50 | $80.00 - $85.00 | Strong | Previous area of significant price consolidation and swing lows from May and June. |
| $68.50 | $65.00 - $72.00 | Strong | Major structural bottom and consolidation zone formed between February and April. |
Resistance Price Levels
| Level | Range | Strength | Notes |
|---|---|---|---|
| $100.75 | $100.00 - $101.50 | Strong | Prior support turned resistance, aligning closely with the 200-day SMA (100.67) and psychological round number. |
| $106.25 | $105.00 - $107.50 | Strong | Recent breakdown level and current position of the declining 20-day SMA. |
| $117.50 | $115.00 - $120.00 | Strong | Recent peak highs and the top of the preceding consolidation structure. |
Potential Chart Patterns in Formation
| Strength | Pattern | Signal | Target | Details |
|---|---|---|---|---|
| Strong | Head and Shoulders Top Breakdown | Bearish | $90.00 | A topping structure is visible with a left shoulder around 110, a head near 120, and a right shoulder near 115. Price has now decisively broken the neckline support area (~100-105). |
Frequently Asked Questions about HOOD
What is the current sentiment for HOOD?
The short-term sentiment for HOOD is currently Bearish because Price has sharply broken down below recent consolidation, the 50-day SMA, and the 200-day SMA on elevated volume. MACD has crossed bearishly with an expanding negative histogram, and RSI is pointing steeply downward.. The long-term trend is classified as Bearish.
What are the key support levels for HOOD?
StockDips.AI has identified key support levels for HOOD at $93.75 and $82.50. These levels may represent potential accumulation zones where buying interest could emerge.
Is HOOD in a significant dip or a Value Dip right now?
HOOD has a Value Score of 84/100. It is currently flagged as a significant dip in the Top Dips list. It is not listed as a Value Dip because the long-term sentiment or value-score threshold does not qualify.
View the full interactive analysis on StockDips.AI.