BMNR Monthly Technical Analysis
BitMine Immersion Technologies Inc
Developer of immersion cooling technology for crypto mining equipment.
BMNR Technical Analysis Summary
BMNR exhibits a 'zombie stock' recovery profile, having recently awakened from a massive multi-year dormancy with significant volume expansion. While the long-term trend remains capped by the distant 200-month SMA at 156.12, the price is attempting to establish a new base above the 20-month and 50-month SMAs (~20-22). Short-term indicators suggest a cooling period or correction is underway following a volatility spike, requiring the stock to hold the 20.00-22.00 zone to prove the sustainability of this new active phase.
Included In Lists
Related Tickers of Interest
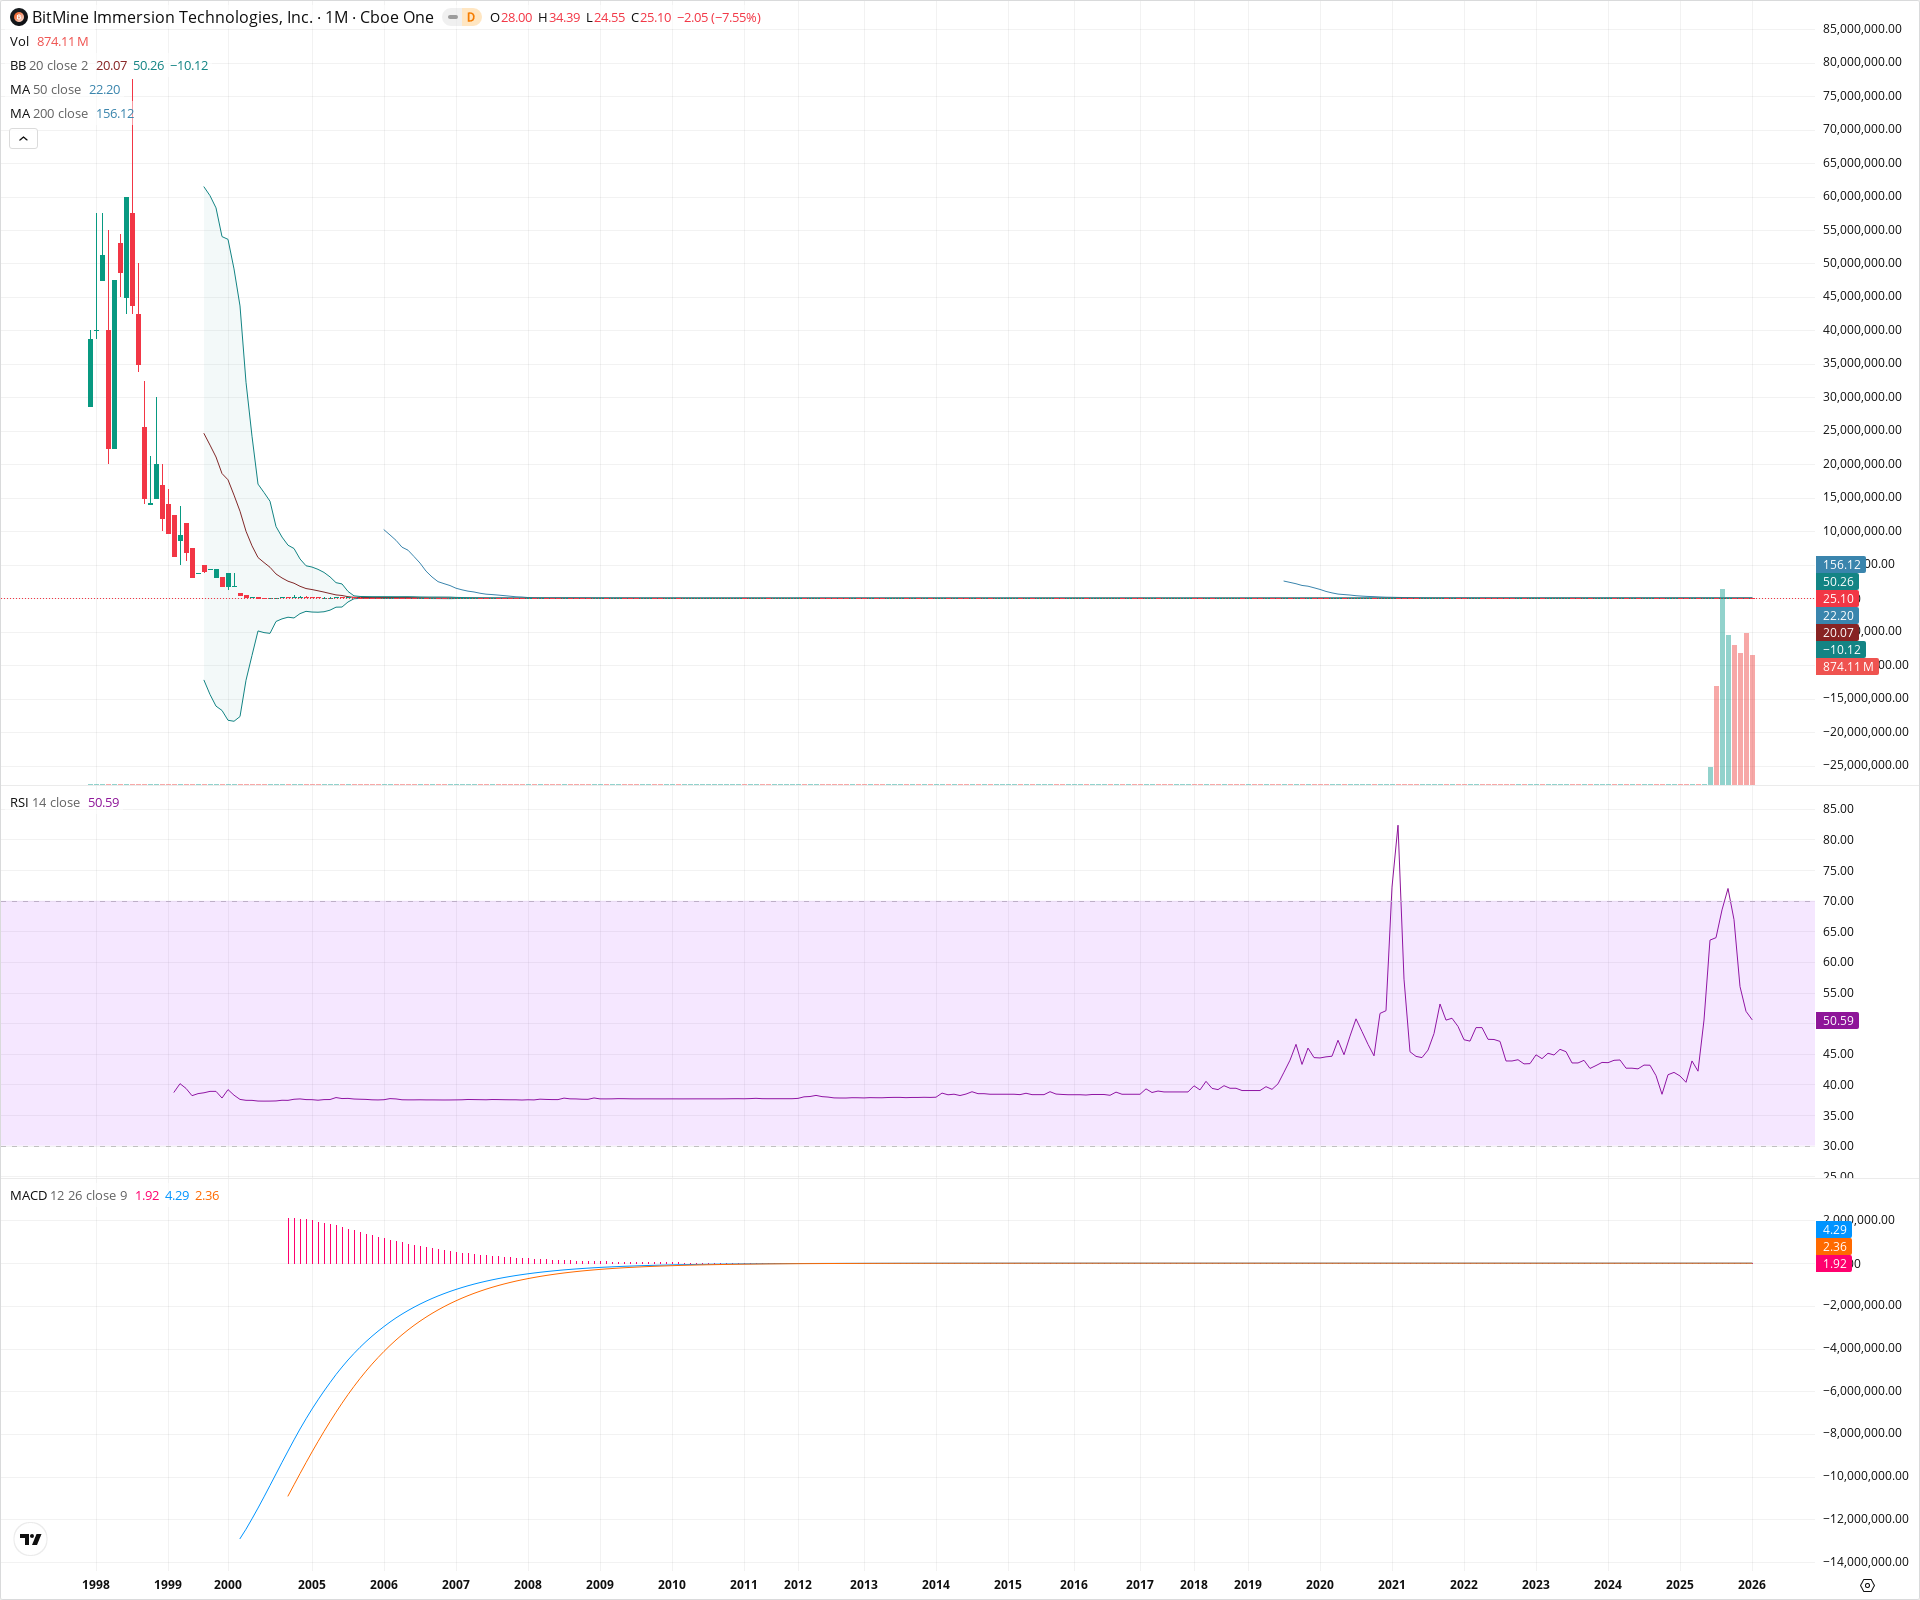
BMNR Monthly Chart
Sentiment
Short-term Sentiment (days to weeks): Bearish
The stock is currently experiencing a sharp correction, down over 7.5% for the month. The RSI has plummeted from overbought levels back to near 50, indicating rapidly fading momentum. Additionally, the MACD line (1.92) is below the Signal line (4.29), confirming a bearish momentum crossover in the short term.
Long-term Sentiment (weeks to months): Neutral
After a multi-decade period of dormancy, the stock has recently seen a surge in volume and volatility, indicating a potential regime change. It is currently trading above the 20-month (20.07) and 50-month (22.20) SMAs, which is constructive. However, it remains significantly below the long-term 200-month SMA (156.12), leaving it in a transitional zone rather than a confirmed secular bull trend.
Report Metadata
- Timeframe: monthly
- Generated at: 2026-02-02T05:32:15.777Z
- Model: gemini-3-pro-preview
Support Price Levels
| Level | Range | Strength | Notes |
|---|---|---|---|
| $22.20 | $22.20 - $22.20 | Strong | 50-period Simple Moving Average acting as immediate dynamic support. |
| $20.07 | $20.07 - $20.07 | Strong | 20-period SMA and Bollinger Band basis line; a critical level to maintain the recent structural recovery. |
Resistance Price Levels
| Level | Range | Strength | Notes |
|---|---|---|---|
| $34.39 | $34.39 - $34.39 | Weak | Current monthly high acting as immediate overhead resistance. |
| $50.26 | $50.26 - $50.26 | Strong | Upper Bollinger Band level representing the volatility ceiling. |
| $156.12 | $156.12 - $156.12 | Strong | 200-period Simple Moving Average; the major long-term structural barrier. |
Potential Chart Patterns in Formation
| Strength | Pattern | Signal | Target | Details |
|---|---|---|---|---|
| Weak | Secular Base Breakout | Bullish | N/A | After essentially flatlining for nearly two years (and decades prior on the chart), the price has recently expanded in range and volume, breaking above short-term moving averages. |
Frequently Asked Questions about BMNR
What is the current sentiment for BMNR?
The short-term sentiment for BMNR is currently Bearish because The stock is currently experiencing a sharp correction, down over 7.5% for the month. The RSI has plummeted from overbought levels back to near 50, indicating rapidly fading momentum. Additionally, the MACD line (1.92) is below the Signal line (4.29), confirming a bearish momentum crossover in the short term.. The long-term trend is classified as Neutral.
What are the key support levels for BMNR?
StockDips.AI has identified key support levels for BMNR at $22.20 and $20.07. These levels may represent potential accumulation zones where buying interest could emerge.
Is BMNR in a significant dip or a Value Dip right now?
BMNR has a Value Score of 288/100. It is not currently flagged as a significant dip in the Top Dips list. It is not listed as a Value Dip because the long-term sentiment or value-score threshold does not qualify.
View the full interactive analysis on StockDips.AI.