CIFR Monthly Technical Analysis
Cipher Mining Inc
U.S. Bitcoin mining company operating large-scale data centers.
CIFR Technical Analysis Summary
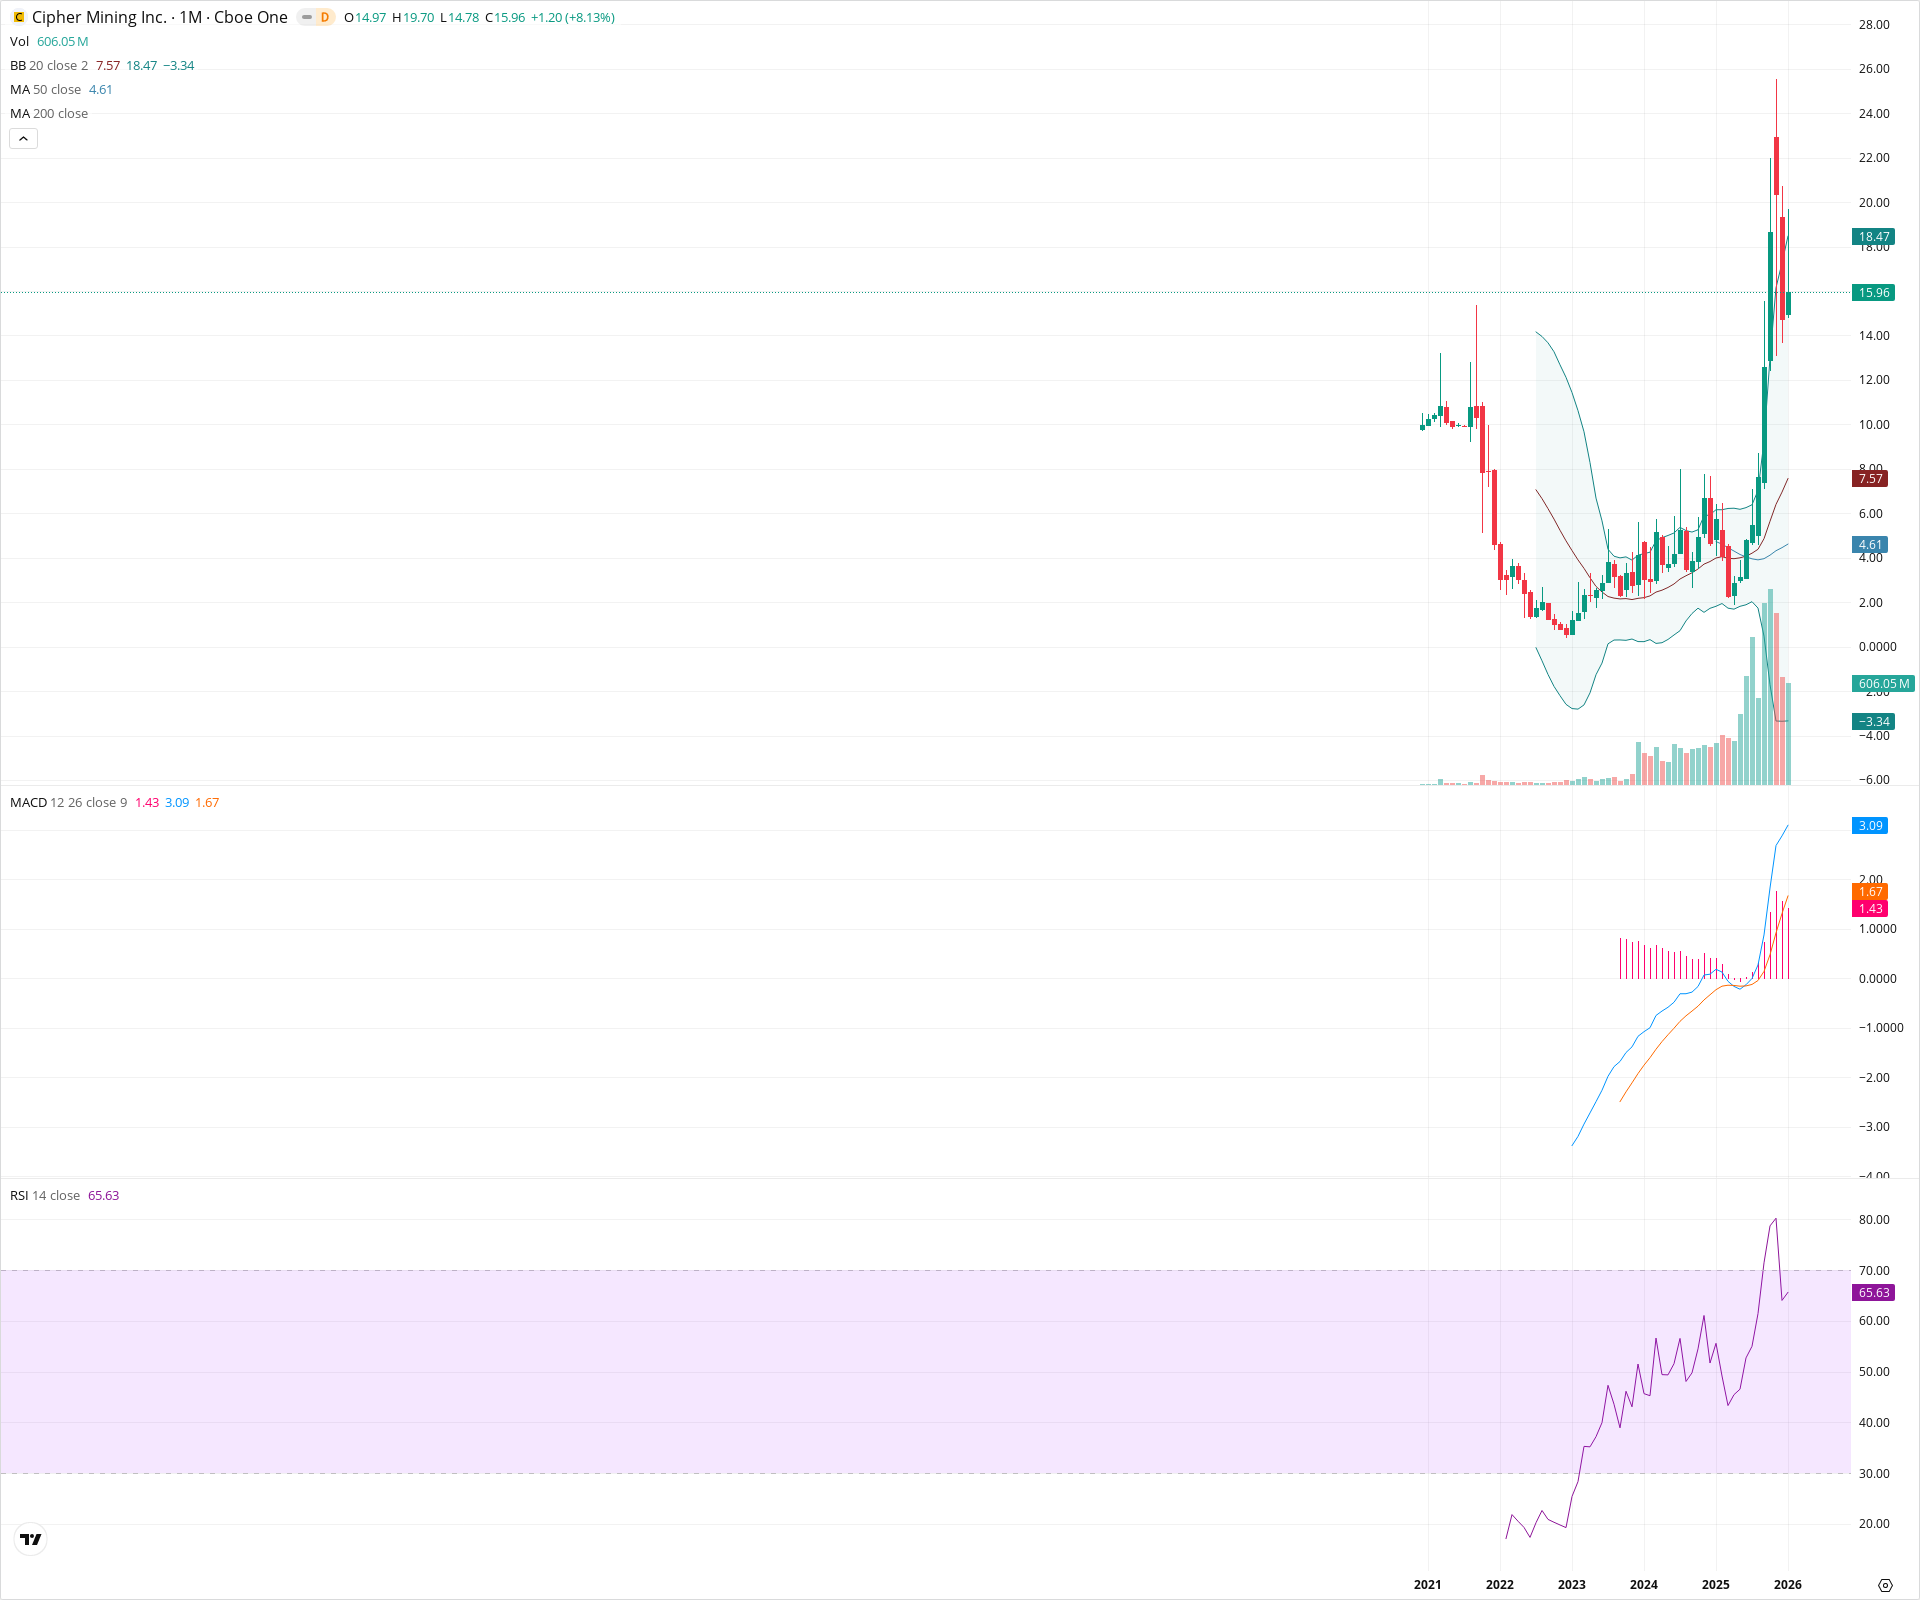
Cipher Mining Inc. exhibits a decisive long-term trend reversal, transitioning from a multi-year rounding bottom accumulation phase into a high-momentum markup phase. The recent breakout is supported by expanding volume and a bullish MACD regime, with price holding well above key moving averages. While the current candle's upper wick suggests volatility near the $19.70 highs, the structural outlook remains bullish as long as price holds above the breakout support zone around $7.60.
Included In Lists
Related Tickers of Interest
CIFR Monthly Chart
Sentiment
Short-term Sentiment (days to weeks): Bullish
The stock is up over 8% for the month with strong momentum, though the long upper wick (high of 19.70 vs close of 15.96) indicates some profit-taking at the highs.
Long-term Sentiment (weeks to months): Bullish
Price has successfully broken out of a multi-year rounding bottom base. The 50-period SMA is turning upward, and MACD is in a strong positive expansion regime.
Report Metadata
- Timeframe: monthly
- Generated at: 2026-02-02T05:30:23.742Z
- Model: gemini-3-pro-preview
Support Price Levels
| Level | Range | Strength | Notes |
|---|---|---|---|
| $6.80 | $6.00 - $7.60 | Strong | Major breakout zone confluence with the 20-month SMA (7.57). |
| $4.30 | $4.00 - $4.60 | Strong | Aligns with the rising 50-month SMA (4.61) and the upper boundary of the previous consolidation base. |
Resistance Price Levels
| Level | Range | Strength | Notes |
|---|---|---|---|
| $19.70 | $19.70 - $19.70 | Strong | Current monthly high and likely all-time high territory; immediate resistance. |
| $24.50 | $24.00 - $25.00 | Weak | Psychological extension level above current price discovery range. |
Potential Chart Patterns in Formation
| Strength | Pattern | Signal | Target | Details |
|---|---|---|---|---|
| Strong | Rounding Bottom | Bullish | N/A | A multi-year saucer formation spanning 2022 to 2024, representing a long-term accumulation phase before the recent vertical breakout. |
Frequently Asked Questions about CIFR
What is the current sentiment for CIFR?
The short-term sentiment for CIFR is currently Bullish because The stock is up over 8% for the month with strong momentum, though the long upper wick (high of 19.70 vs close of 15.96) indicates some profit-taking at the highs.. The long-term trend is classified as Bullish.
What are the key support levels for CIFR?
StockDips.AI has identified key support levels for CIFR at $6.80 and $4.30. These levels may represent potential accumulation zones where buying interest could emerge.
Is CIFR in a significant dip or a Value Dip right now?
CIFR has a Value Score of 59/100. It is not currently flagged as a significant dip in the Top Dips list. It is not listed as a Value Dip because the long-term sentiment or value-score threshold does not qualify.
View the full interactive analysis on StockDips.AI.