IREN Daily Technical Analysis
Iris Energy Ltd
Bitcoin miner focusing on renewable energy-powered operations.
IREN Technical Analysis Summary
IREN has suffered a severe technical breakdown, confirming a transition into a long-term bearish trend. The decisive loss of the 40-44 support zone completes a massive multi-month topping pattern, further validated by a moving average 'death cross'. With short-term momentum failing to mount a recovery, the path of least resistance remains lower toward the mid-30s support zone.
Included In Lists
Related Tickers of Interest
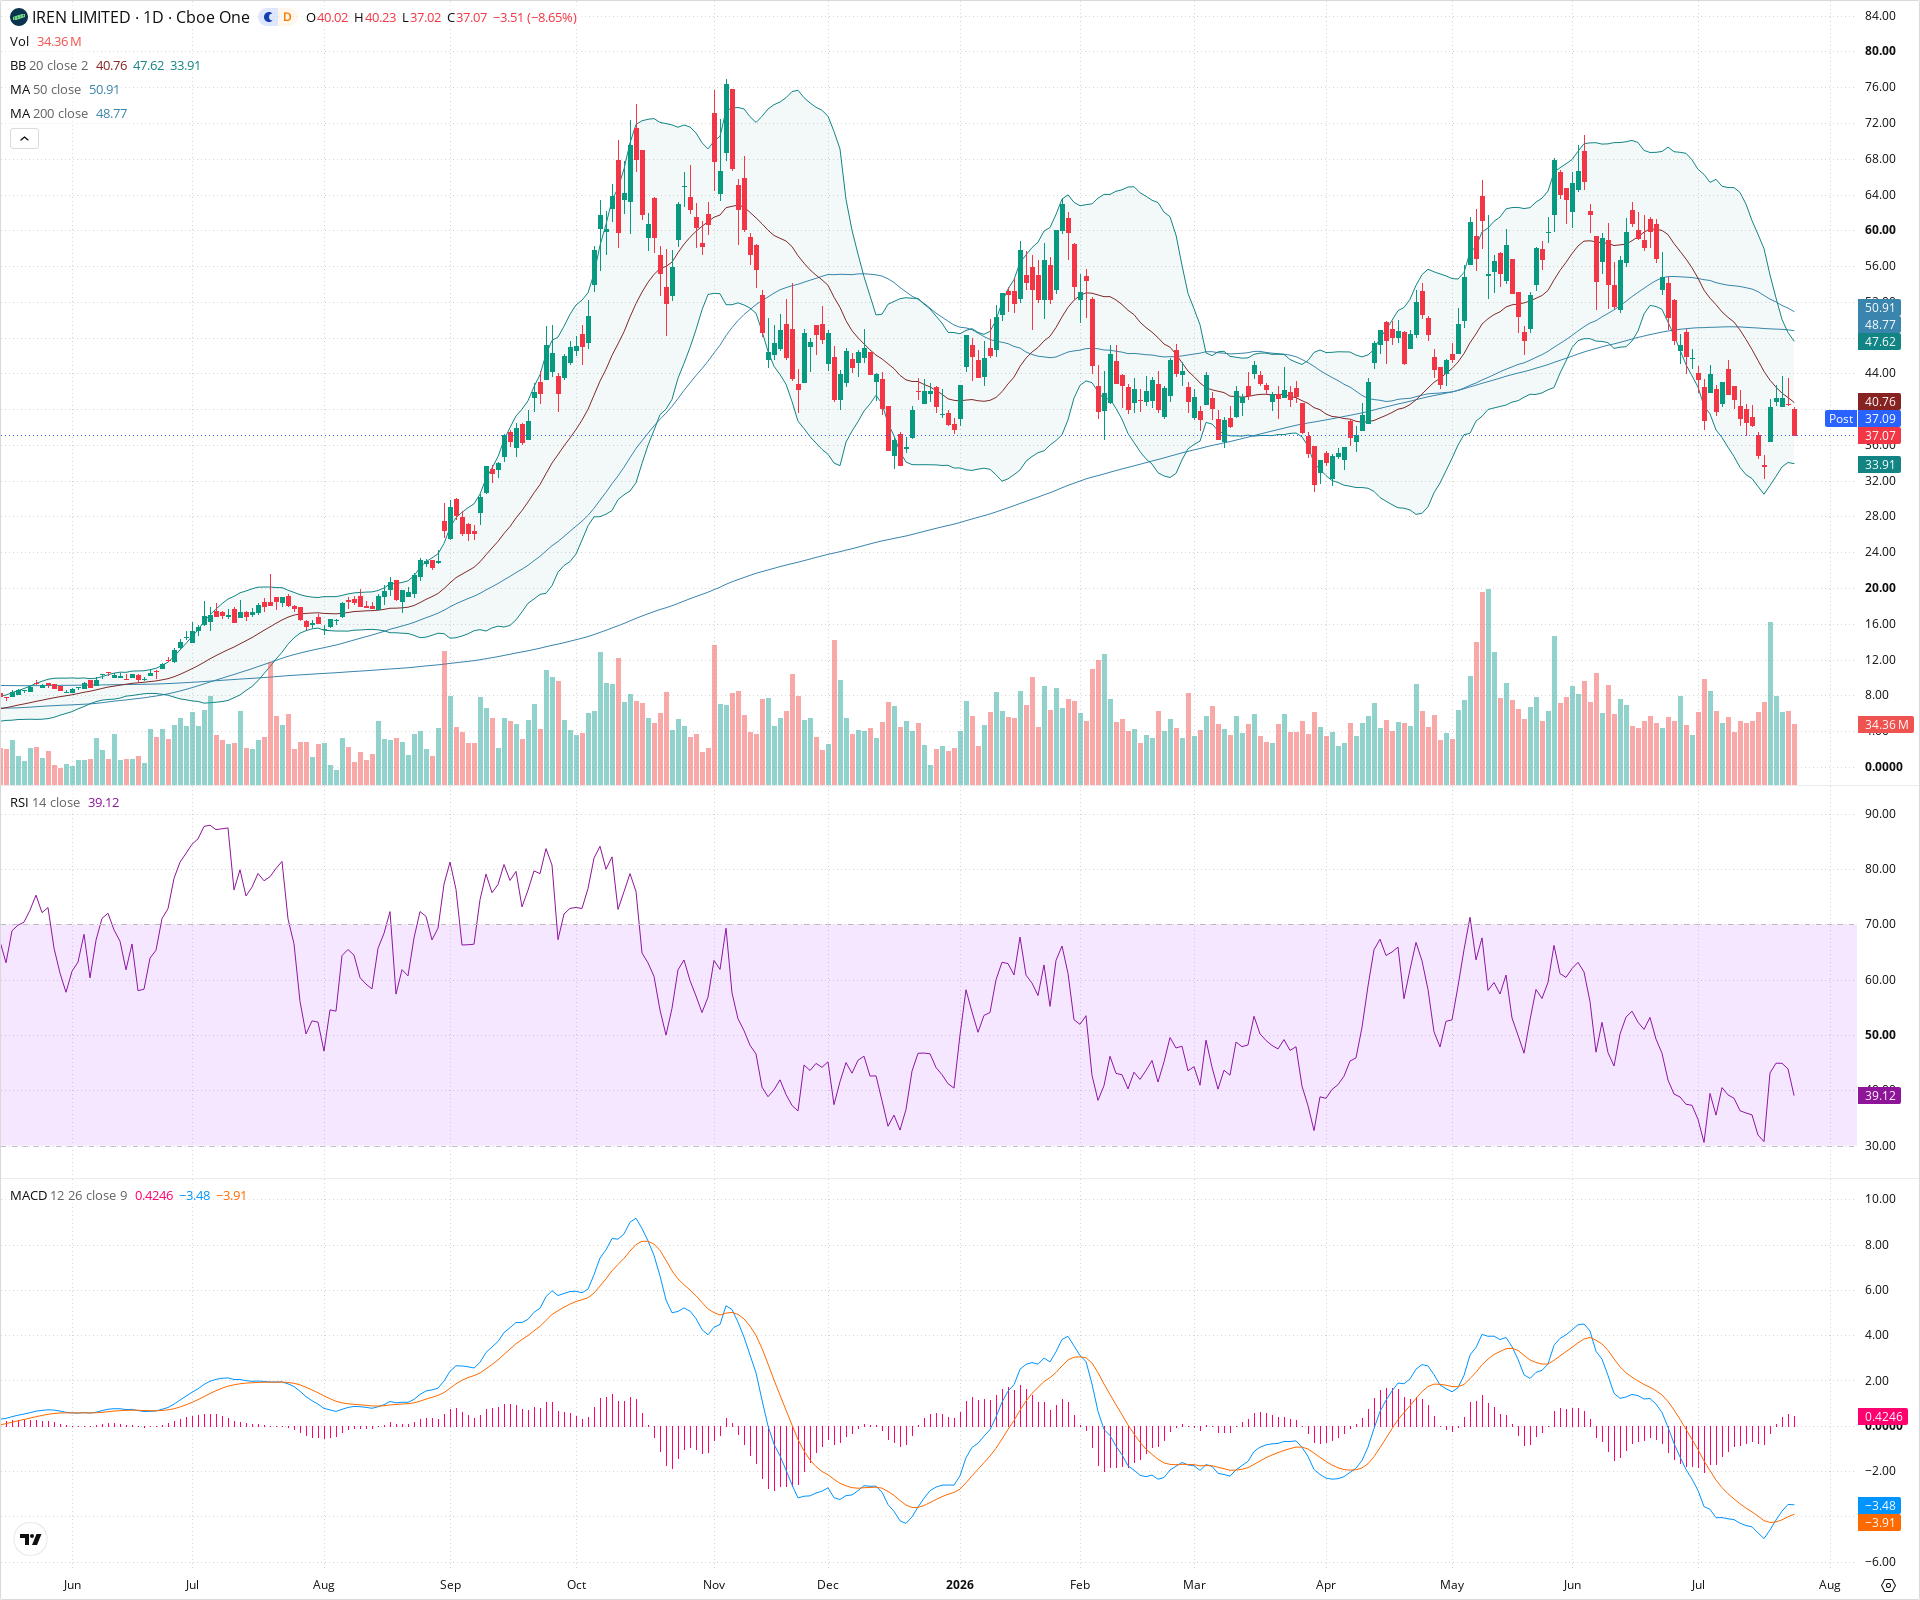
IREN Daily Chart
Sentiment
Short-term Sentiment (days to weeks): Bearish
Price sharply broke below a critical support zone (40-44) with a strong bearish candle, closing near the daily low. Although MACD had a recent bullish crossover in negative territory, the price action is ignoring it, indicating overwhelming selling pressure and a failed momentum shift.
Long-term Sentiment (weeks to months): Bearish
The chart shows the completion of a massive, multi-month topping structure. The price has fallen below the 200-day SMA, and a 'death cross' (50 SMA crossing below 200 SMA) has formed, confirming a major trend reversal from bullish to bearish.
Report Metadata
- Timeframe: daily
- Generated at: 2026-07-24T21:07:05.599Z
- Model: gemini-3.1-pro-preview
Support Price Levels
| Level | Range | Strength | Notes |
|---|---|---|---|
| $34.00 | $32.00 - $36.00 | Strong | Previous major swing low consolidation zone from December/January. |
| $28.00 | $26.00 - $30.00 | Weak | Older, less distinct support level from the initial stages of the prior uptrend (September). |
Resistance Price Levels
| Level | Range | Strength | Notes |
|---|---|---|---|
| $42.00 | $40.00 - $44.00 | Strong | The recently broken major support zone, now expected to act as significant resistance. Aligns closely with the falling 20-day SMA. |
| $50.00 | $48.00 - $52.00 | Strong | Major confluence zone containing the 50-day SMA, 200-day SMA, and historical support/resistance flips. |
Potential Chart Patterns in Formation
| Strength | Pattern | Signal | Target | Details |
|---|---|---|---|---|
| Strong | Major Topping Pattern Breakdown | Bearish | N/A | Price has decisively broken below the 40-44 'neckline' support of a massive distribution pattern formed over the past 8-10 months. |
| Strong | Death Cross | Bearish | N/A | The 50-day Simple Moving Average has crossed below the 200-day Simple Moving Average. |
Frequently Asked Questions about IREN
What is the current sentiment for IREN?
The short-term sentiment for IREN is currently Bearish because Price sharply broke below a critical support zone (40-44) with a strong bearish candle, closing near the daily low. Although MACD had a recent bullish crossover in negative territory, the price action is ignoring it, indicating overwhelming selling pressure and a failed momentum shift.. The long-term trend is classified as Bearish.
What are the key support levels for IREN?
StockDips.AI has identified key support levels for IREN at $34.00 and $28.00. These levels may represent potential accumulation zones where buying interest could emerge.
Is IREN in a significant dip or a Value Dip right now?
IREN has a Value Score of 62/100. It is not currently flagged as a significant dip in the Top Dips list. It is not listed as a Value Dip because the long-term sentiment or value-score threshold does not qualify.
View the full interactive analysis on StockDips.AI.