CRWV Daily Technical Analysis
CoreWeave Inc
A specialized cloud provider for GPU-intensive computing, particularly for artificial intelligence (AI) and machine learning applications.
CRWV Technical Analysis Summary
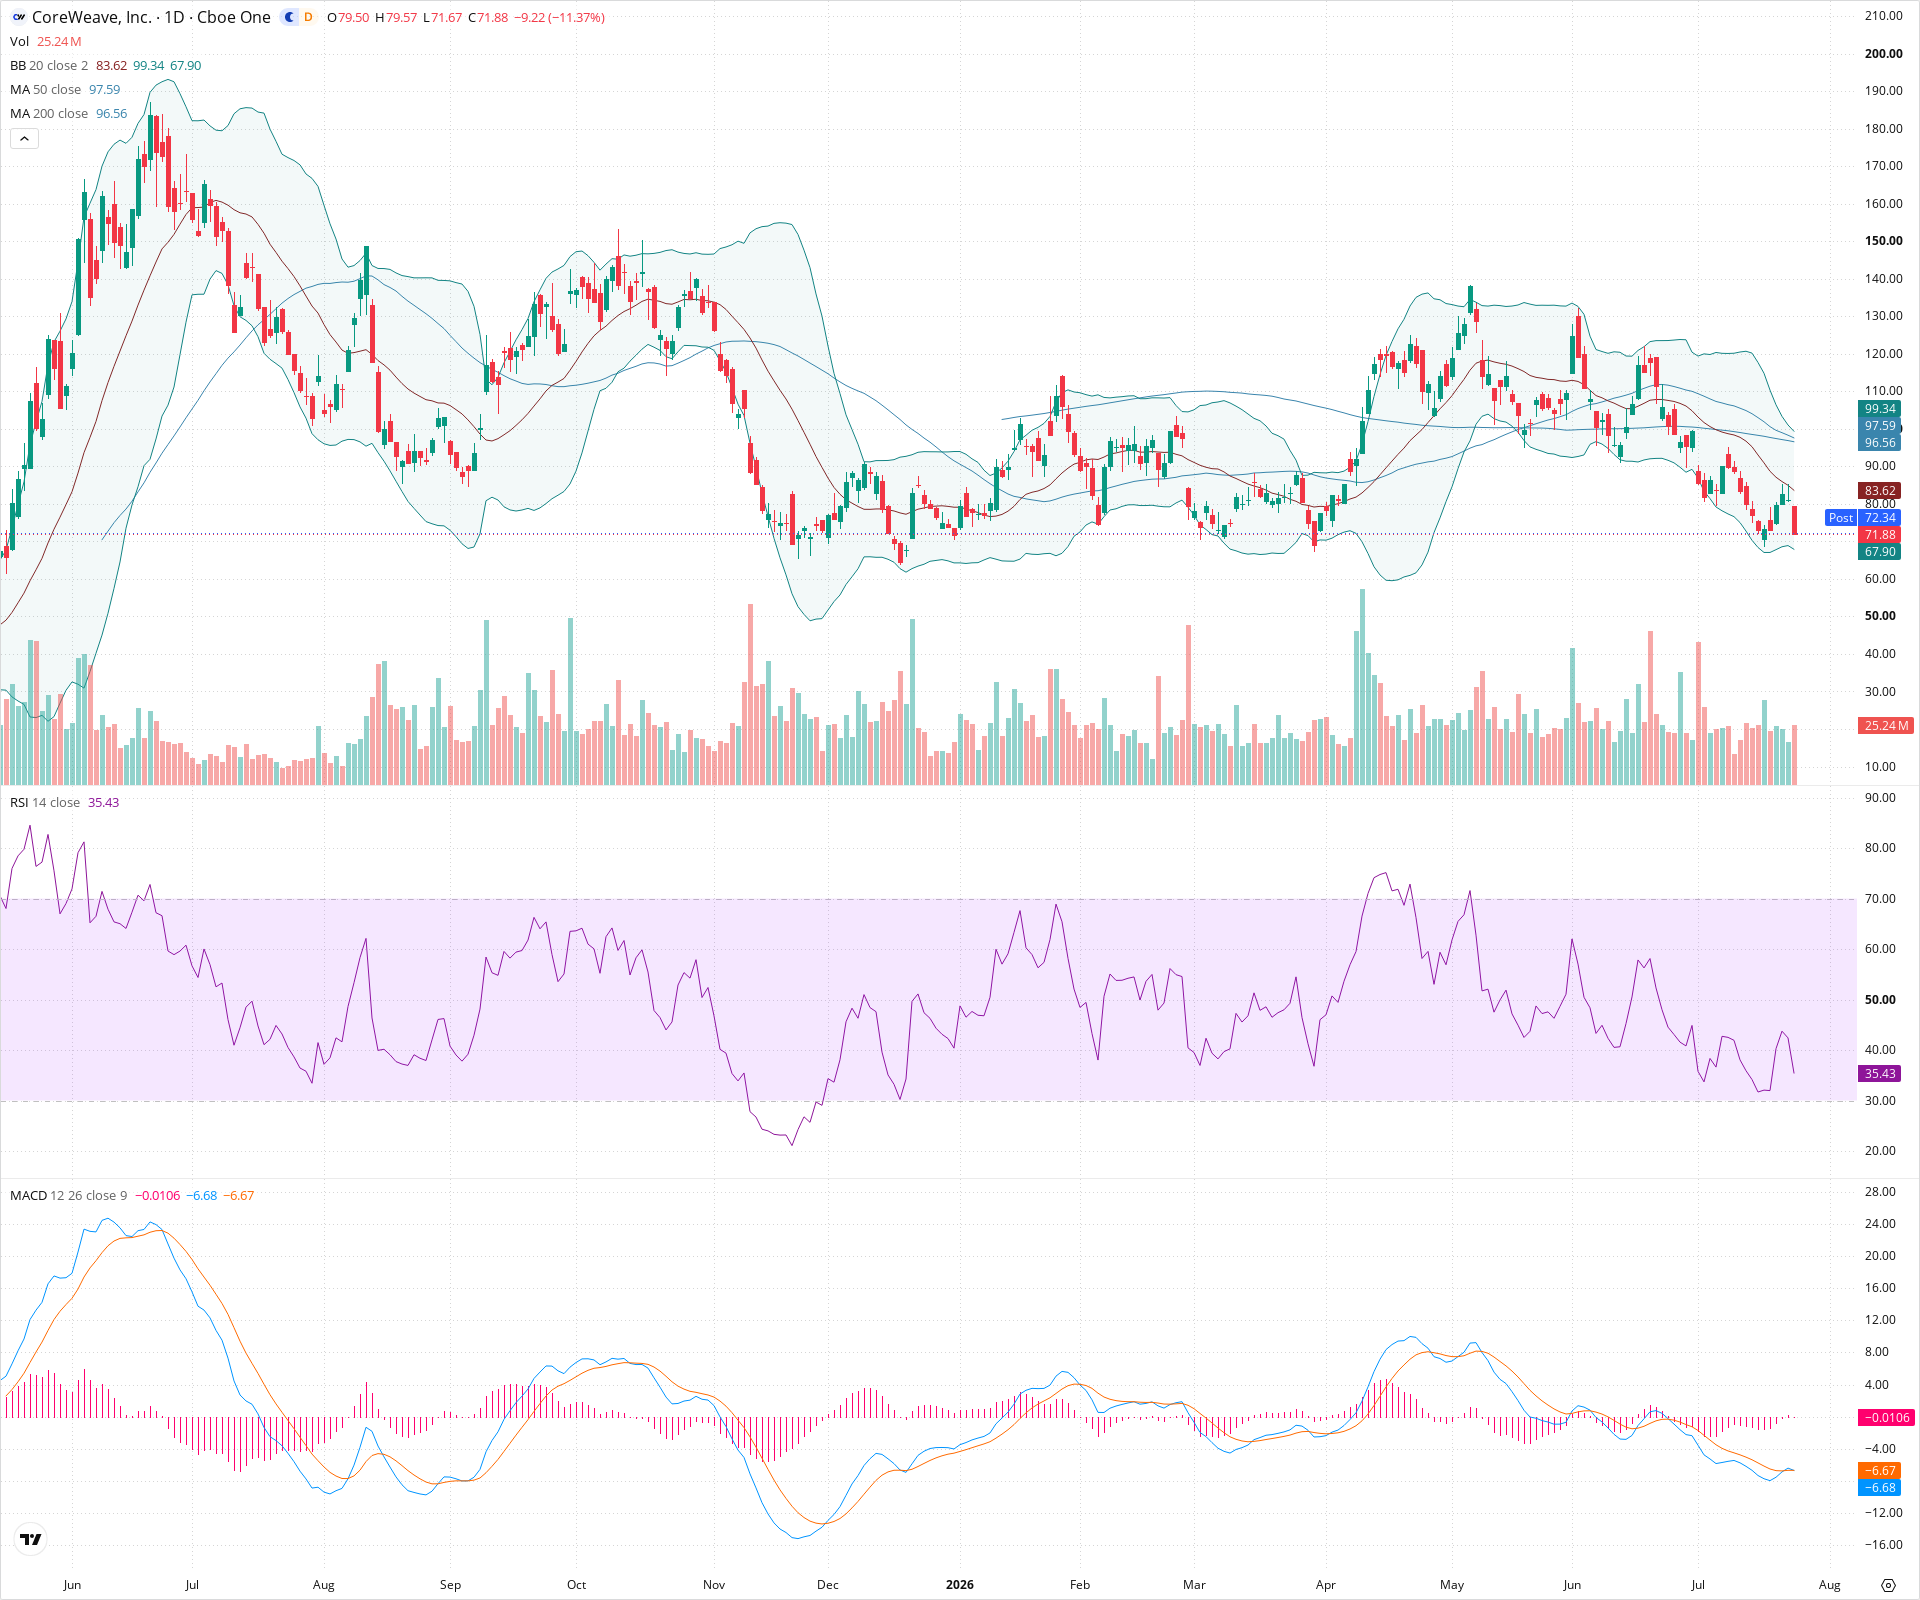
The technical picture for CRWV has deteriorated severely, shifting from a previous long-term uptrend to a dominant bearish phase. The decisive, high-volume break below the 200-day moving average and an impending death cross suggest a major structural reversal is underway. With strong downside momentum and no immediate support nearby, long-term investors face significant ongoing risk.
Included In Lists
Related Tickers of Interest
CRWV Daily Chart
Sentiment
Short-term Sentiment (days to weeks): Bearish
Price is in a steep decline accompanied by heavy selling volume, riding the lower Bollinger Band. RSI is falling towards oversold territory, and the MACD is deep in negative territory, confirming strong downward momentum.
Long-term Sentiment (weeks to months): Bearish
The long-term uptrend has been decisively broken as price plummeted through the 200-day SMA. Furthermore, a 'death cross' (50-day SMA crossing below the 200-day SMA) appears imminent, signaling a major structural trend reversal.
Report Metadata
- Timeframe: daily
- Generated at: 2026-07-24T21:08:02.600Z
- Model: gemini-3.1-pro-preview
Support Price Levels
| Level | Range | Strength | Notes |
|---|---|---|---|
| $63.50 | $62.00 - $65.00 | Strong | Major previous swing low and consolidation area from December. |
| $57.50 | $55.00 - $60.00 | Strong | The lowest visible structural swing low on the chart from November. |
Resistance Price Levels
| Level | Range | Strength | Notes |
|---|---|---|---|
| $82.50 | $80.00 - $85.00 | Strong | Recent breakdown level and current location of the falling 20-day SMA. |
| $97.50 | $95.00 - $100.00 | Strong | Massive resistance zone formed by the convergence of the 50-day and 200-day SMAs, as well as recent structural highs. |
Potential Chart Patterns in Formation
| Strength | Pattern | Signal | Target | Details |
|---|---|---|---|---|
| Strong | Bearish Breakdown | Bearish | $65.00 | Price decisively broke below a long-standing support zone (around 85.00) and the critical 200-day moving average on high volume, initiating a new downward trend phase. |
Frequently Asked Questions about CRWV
What is the current sentiment for CRWV?
The short-term sentiment for CRWV is currently Bearish because Price is in a steep decline accompanied by heavy selling volume, riding the lower Bollinger Band. RSI is falling towards oversold territory, and the MACD is deep in negative territory, confirming strong downward momentum.. The long-term trend is classified as Bearish.
What are the key support levels for CRWV?
StockDips.AI has identified key support levels for CRWV at $63.50 and $57.50. These levels may represent potential accumulation zones where buying interest could emerge.
Is CRWV in a significant dip or a Value Dip right now?
CRWV has a Value Score of 56/100. It is not currently flagged as a significant dip in the Top Dips list. It is not listed as a Value Dip because the long-term sentiment or value-score threshold does not qualify.
View the full interactive analysis on StockDips.AI.