CORZ Monthly Technical Analysis
Core Scientific Inc
Major U.S. Bitcoin miner providing hosting and self-mining services.
CORZ Technical Analysis Summary
Core Scientific (CORZ) is exhibiting a powerful bullish trend on the monthly timeframe, characterized by a sharp recovery and sustained price action above the 20-month moving average. The RSI at ~62 supports further upside potential, with the immediate technical test lying at the 20.00–21.00 resistance zone. Long-term structure remains constructive as long as the price holds above the key 13.50 support level.
Included In Lists
Related Tickers of Interest
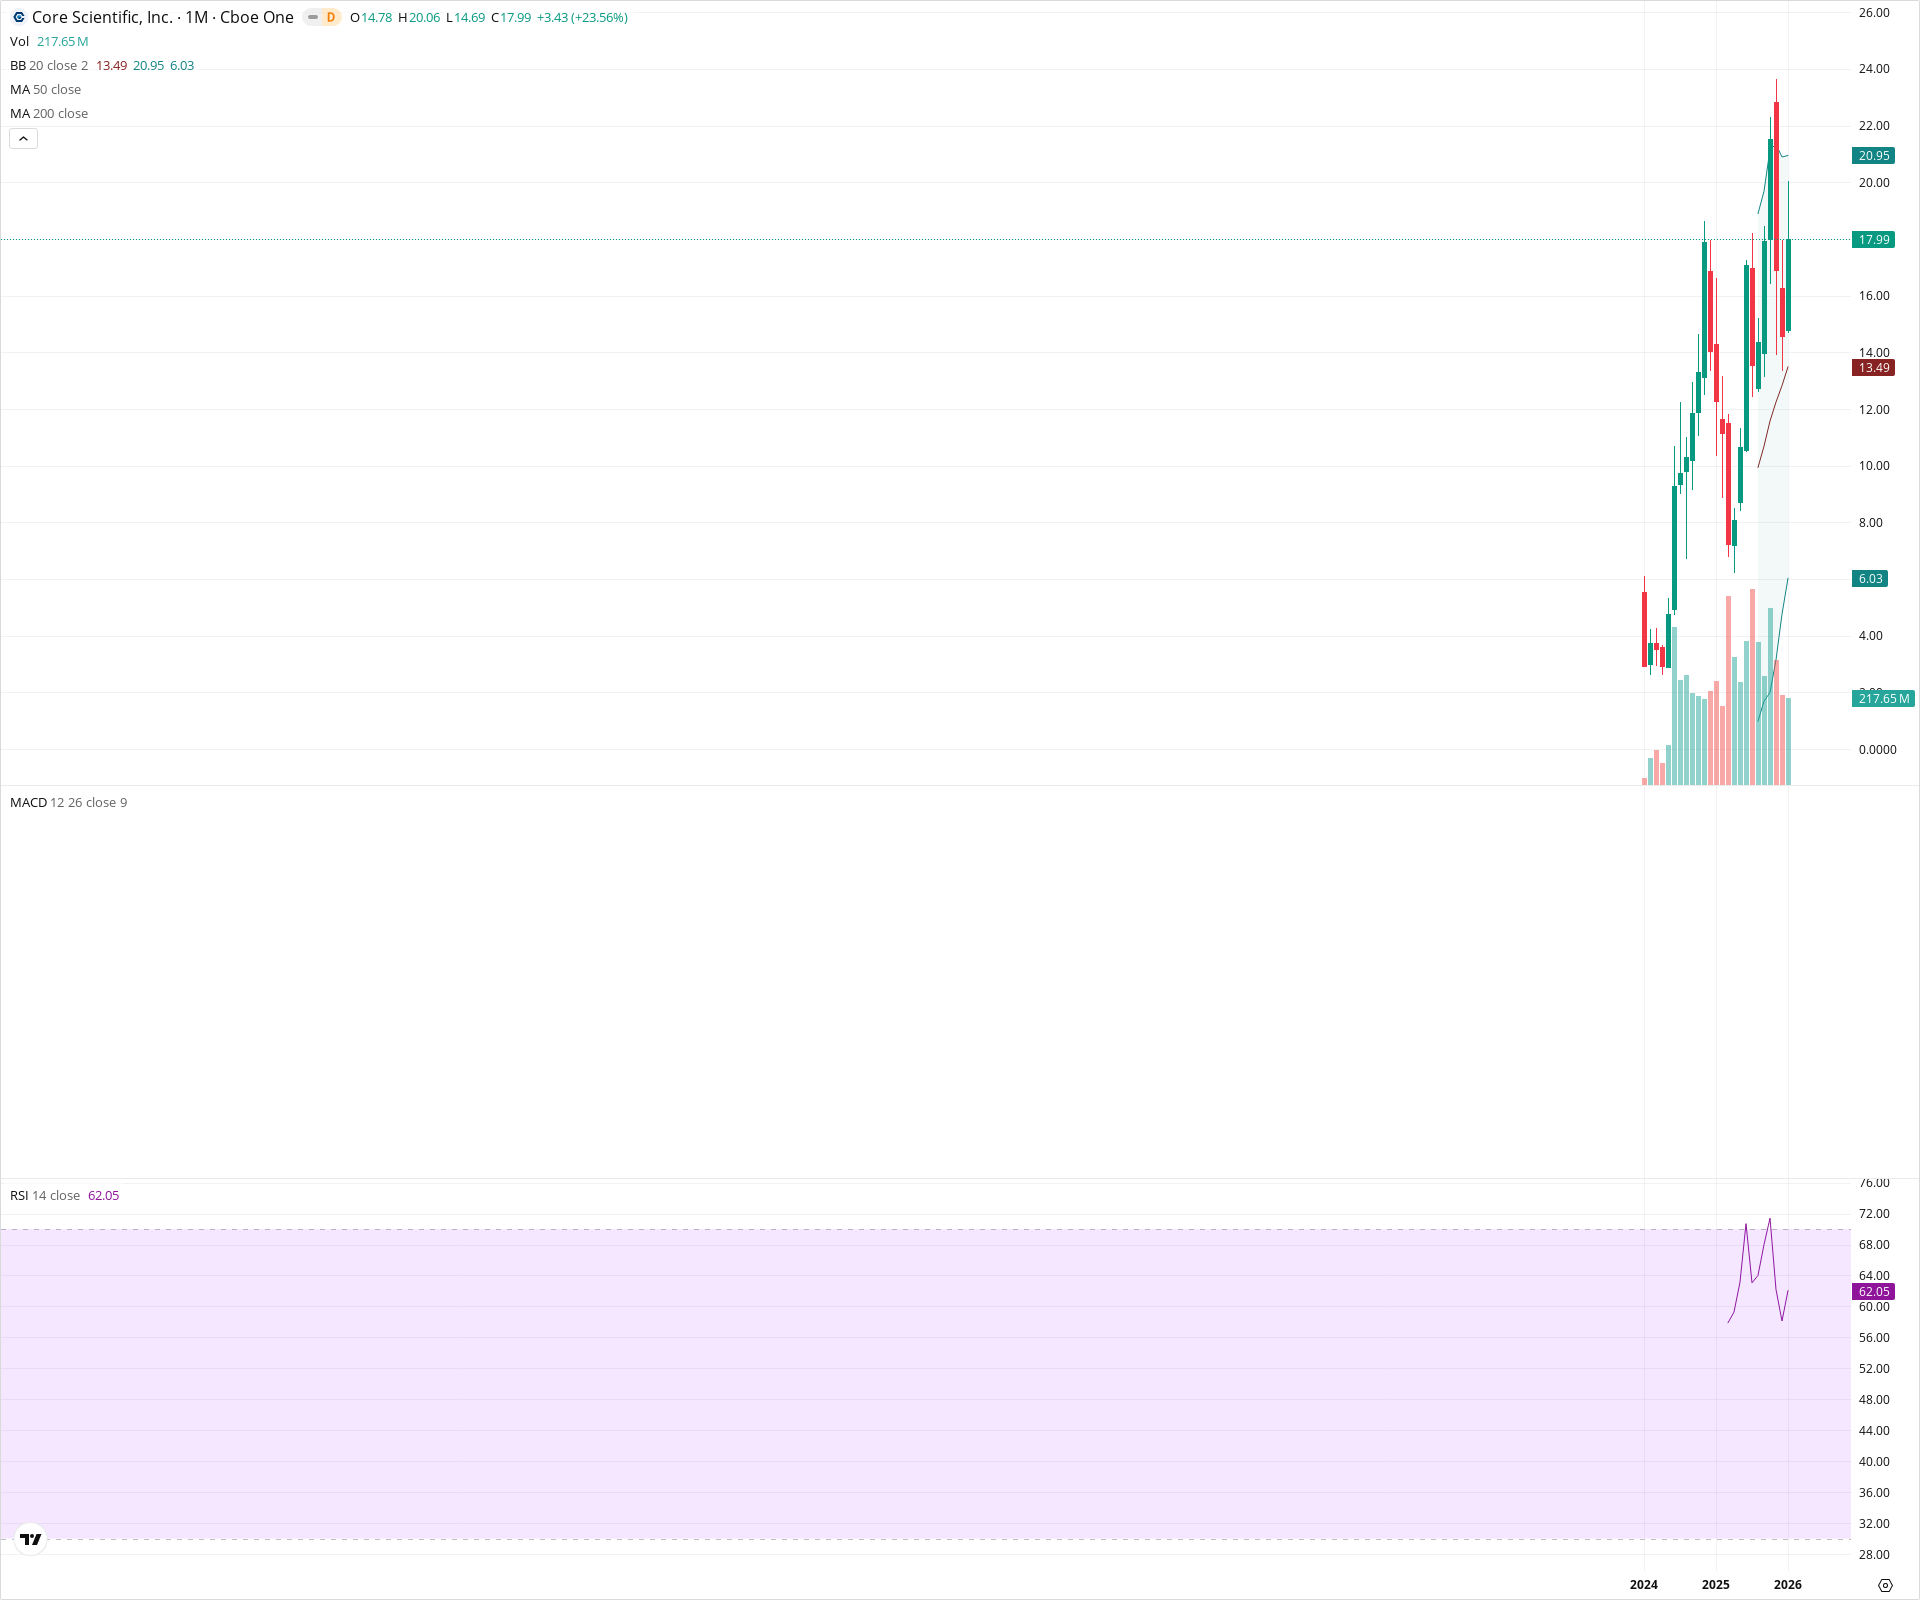
CORZ Monthly Chart
Sentiment
Short-term Sentiment (days to weeks): Bullish
The current monthly candle is strongly bullish, trading significantly higher (+23.56%) and pushing back toward recent highs. Price is holding firmly above the 20-month SMA basis (13.49).
Long-term Sentiment (weeks to months): Bullish
The stock is in a confirmed strong uptrend with a sequence of higher highs and higher lows. The RSI is at 62.05, indicating strong secular momentum without being overbought, and price action is sustained in the upper Bollinger channel.
Report Metadata
- Timeframe: monthly
- Generated at: 2026-02-02T05:30:22.111Z
- Model: gemini-3-pro-preview
Support Price Levels
| Level | Range | Strength | Notes |
|---|---|---|---|
| $13.50 | $13.49 - $13.50 | Strong | The 20-period SMA (Bollinger Band basis) acts as dynamic support. |
| $9.25 | $8.50 - $10.00 | Weak | Consolidation zone and previous breakout base. |
Resistance Price Levels
| Level | Range | Strength | Notes |
|---|---|---|---|
| $20.51 | $20.06 - $20.95 | Strong | Zone defined by the current candle's high and the Upper Bollinger Band. |
Potential Chart Patterns in Formation
| Strength | Pattern | Signal | Target | Details |
|---|---|---|---|---|
| Strong | Bullish Continuation | Bullish | N/A | After a brief consolidation period (pullback to the 20 SMA), the price has resumed its vertical ascent with a strong impulse candle. |
Frequently Asked Questions about CORZ
What is the current sentiment for CORZ?
The short-term sentiment for CORZ is currently Bullish because The current monthly candle is strongly bullish, trading significantly higher (+23.56%) and pushing back toward recent highs. Price is holding firmly above the 20-month SMA basis (13.49).. The long-term trend is classified as Bullish.
What are the key support levels for CORZ?
StockDips.AI has identified key support levels for CORZ at $13.50 and $9.25. These levels may represent potential accumulation zones where buying interest could emerge.
Is CORZ in a significant dip or a Value Dip right now?
CORZ has a Value Score of 26/100. It is not currently flagged as a significant dip in the Top Dips list. It is not listed as a Value Dip because the long-term sentiment or value-score threshold does not qualify.
View the full interactive analysis on StockDips.AI.