COST Daily Technical Analysis
Costco Wholesale Corp
Membership-based retailer offering bulk goods with strong customer loyalty.
COST Technical Analysis Summary
COST is currently navigating a distinct downtrend, having recently lost support at both its 50-day and 200-day moving averages. While short-term momentum indicators like a bullish MACD crossover hint at a potential relief bounce, the broader structure remains bearish. Reclaiming the moving average cluster around 960-970 is required to neutralize the long-term bearish outlook.
Included In Lists
Related Tickers of Interest
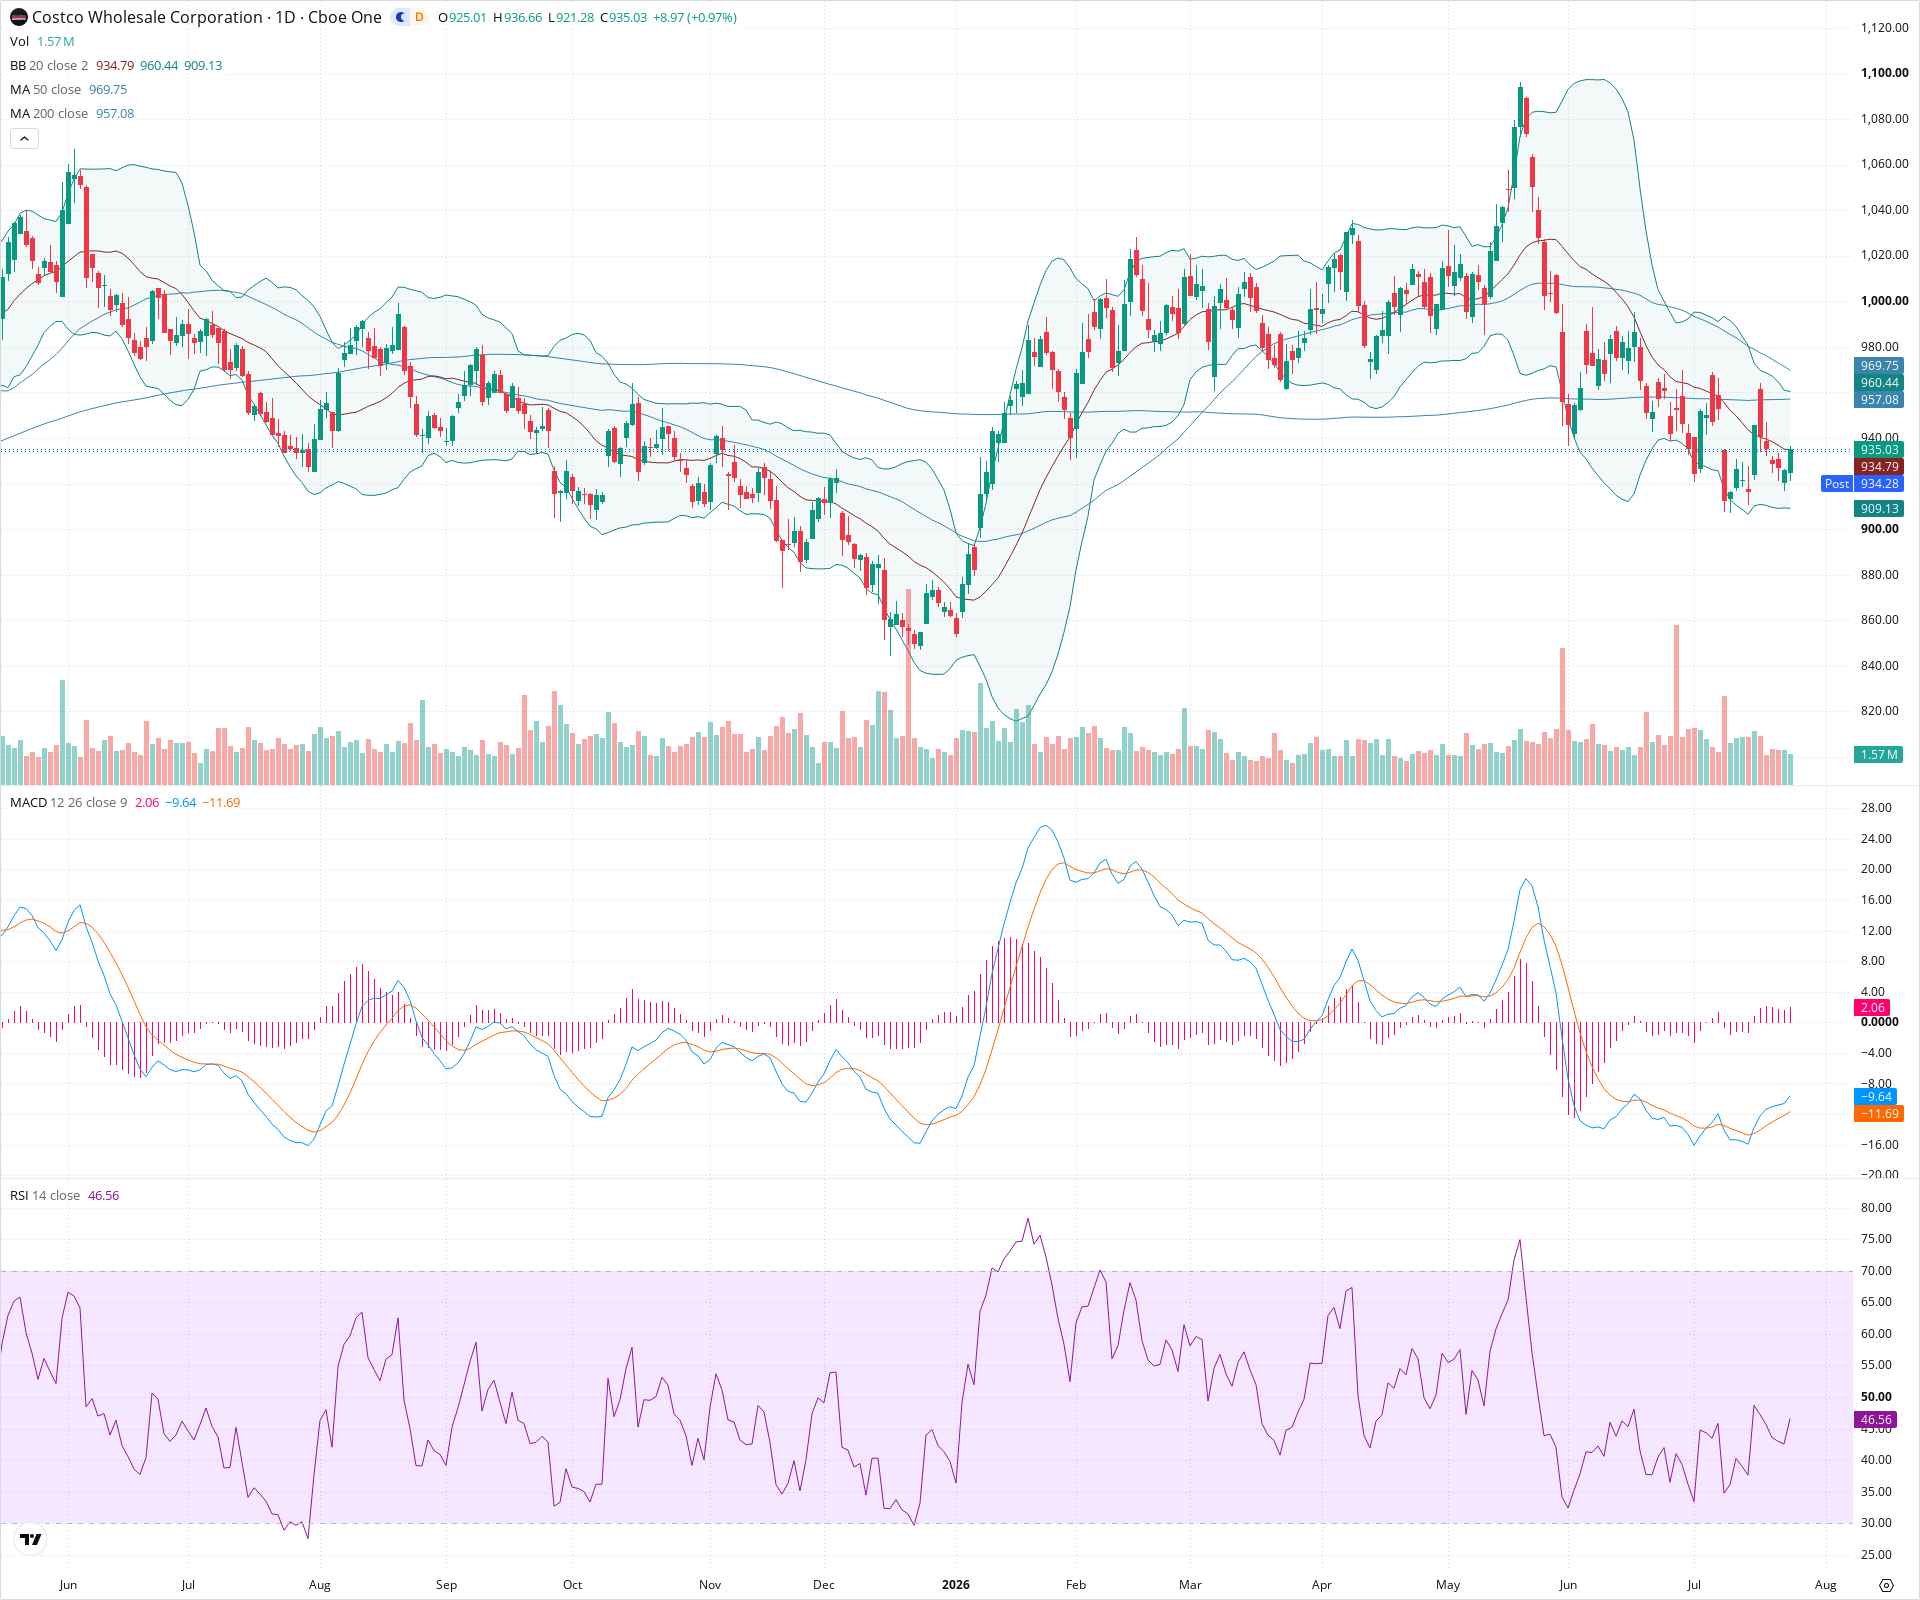
COST Daily Chart
Sentiment
Short-term Sentiment (days to weeks): Neutral
Although the primary short-term trend is downward, momentum indicators like the MACD bullish crossover and rising RSI suggest a potential relief rally or mean reversion toward overhead moving averages.
Long-term Sentiment (weeks to months): Bearish
Price has broken significantly below both the 50-day and 200-day moving averages, establishing a structural downtrend characterized by lower highs and lower lows from the peak.
Report Metadata
- Timeframe: daily
- Generated at: 2026-07-24T21:13:25.802Z
- Model: gemini-3.1-pro-preview
Support Price Levels
| Level | Range | Strength | Notes |
|---|---|---|---|
| $913.50 | $909.00 - $918.00 | Strong | Recent swing low and bounce point, establishing the immediate floor for the current downtrend. |
| $877.50 | $870.00 - $885.00 | Weak | Minor historical consolidation zone visible earlier in the chart. |
Resistance Price Levels
| Level | Range | Strength | Notes |
|---|---|---|---|
| $965.00 | $955.00 - $975.00 | Strong | Convergence zone of the declining 200-day SMA and the relatively flat 50-day SMA, acting as major overhead supply. |
| $1,000.00 | $990.00 - $1,010.00 | Medium | Psychological round number and prior structural support turned resistance. |
Potential Chart Patterns in Formation
| Strength | Pattern | Signal | Target | Details |
|---|---|---|---|---|
| Strong | Moving Average Breakdown | Bearish | N/A | Price decisively broke below the 200-day SMA and has failed to reclaim it, signaling a significant loss of long-term momentum. |
| Strong | Downtrend Structure | Bearish | N/A | A clear sequence of lower highs and lower lows originating from the peak near 1080. |
Frequently Asked Questions about COST
What is the current sentiment for COST?
The short-term sentiment for COST is currently Neutral because Although the primary short-term trend is downward, momentum indicators like the MACD bullish crossover and rising RSI suggest a potential relief rally or mean reversion toward overhead moving averages.. The long-term trend is classified as Bearish.
What are the key support levels for COST?
StockDips.AI has identified key support levels for COST at $913.50 and $877.50. These levels may represent potential accumulation zones where buying interest could emerge.
Is COST in a significant dip or a Value Dip right now?
COST has a Value Score of 58/100. It is not currently flagged as a significant dip in the Top Dips list. It is not listed as a Value Dip because the long-term sentiment or value-score threshold does not qualify.
View the full interactive analysis on StockDips.AI.