COST Monthly Technical Analysis
Costco Wholesale Corp
Membership-based retailer offering bulk goods with strong customer loyalty.
COST Technical Analysis Summary
Costco exhibits a robust long-term bullish structure, anchored by a steep ascent well above its 50-month and 200-month moving averages. While the primary trend is undeniably positive, recent indicators such as the bearish MACD crossover and price retraction from the 1000 level suggest a period of monthly consolidation or mean reversion is underway. Investors should watch the 20-month SMA closely as a pivotal dynamic support level.
Included In Lists
Related Tickers of Interest
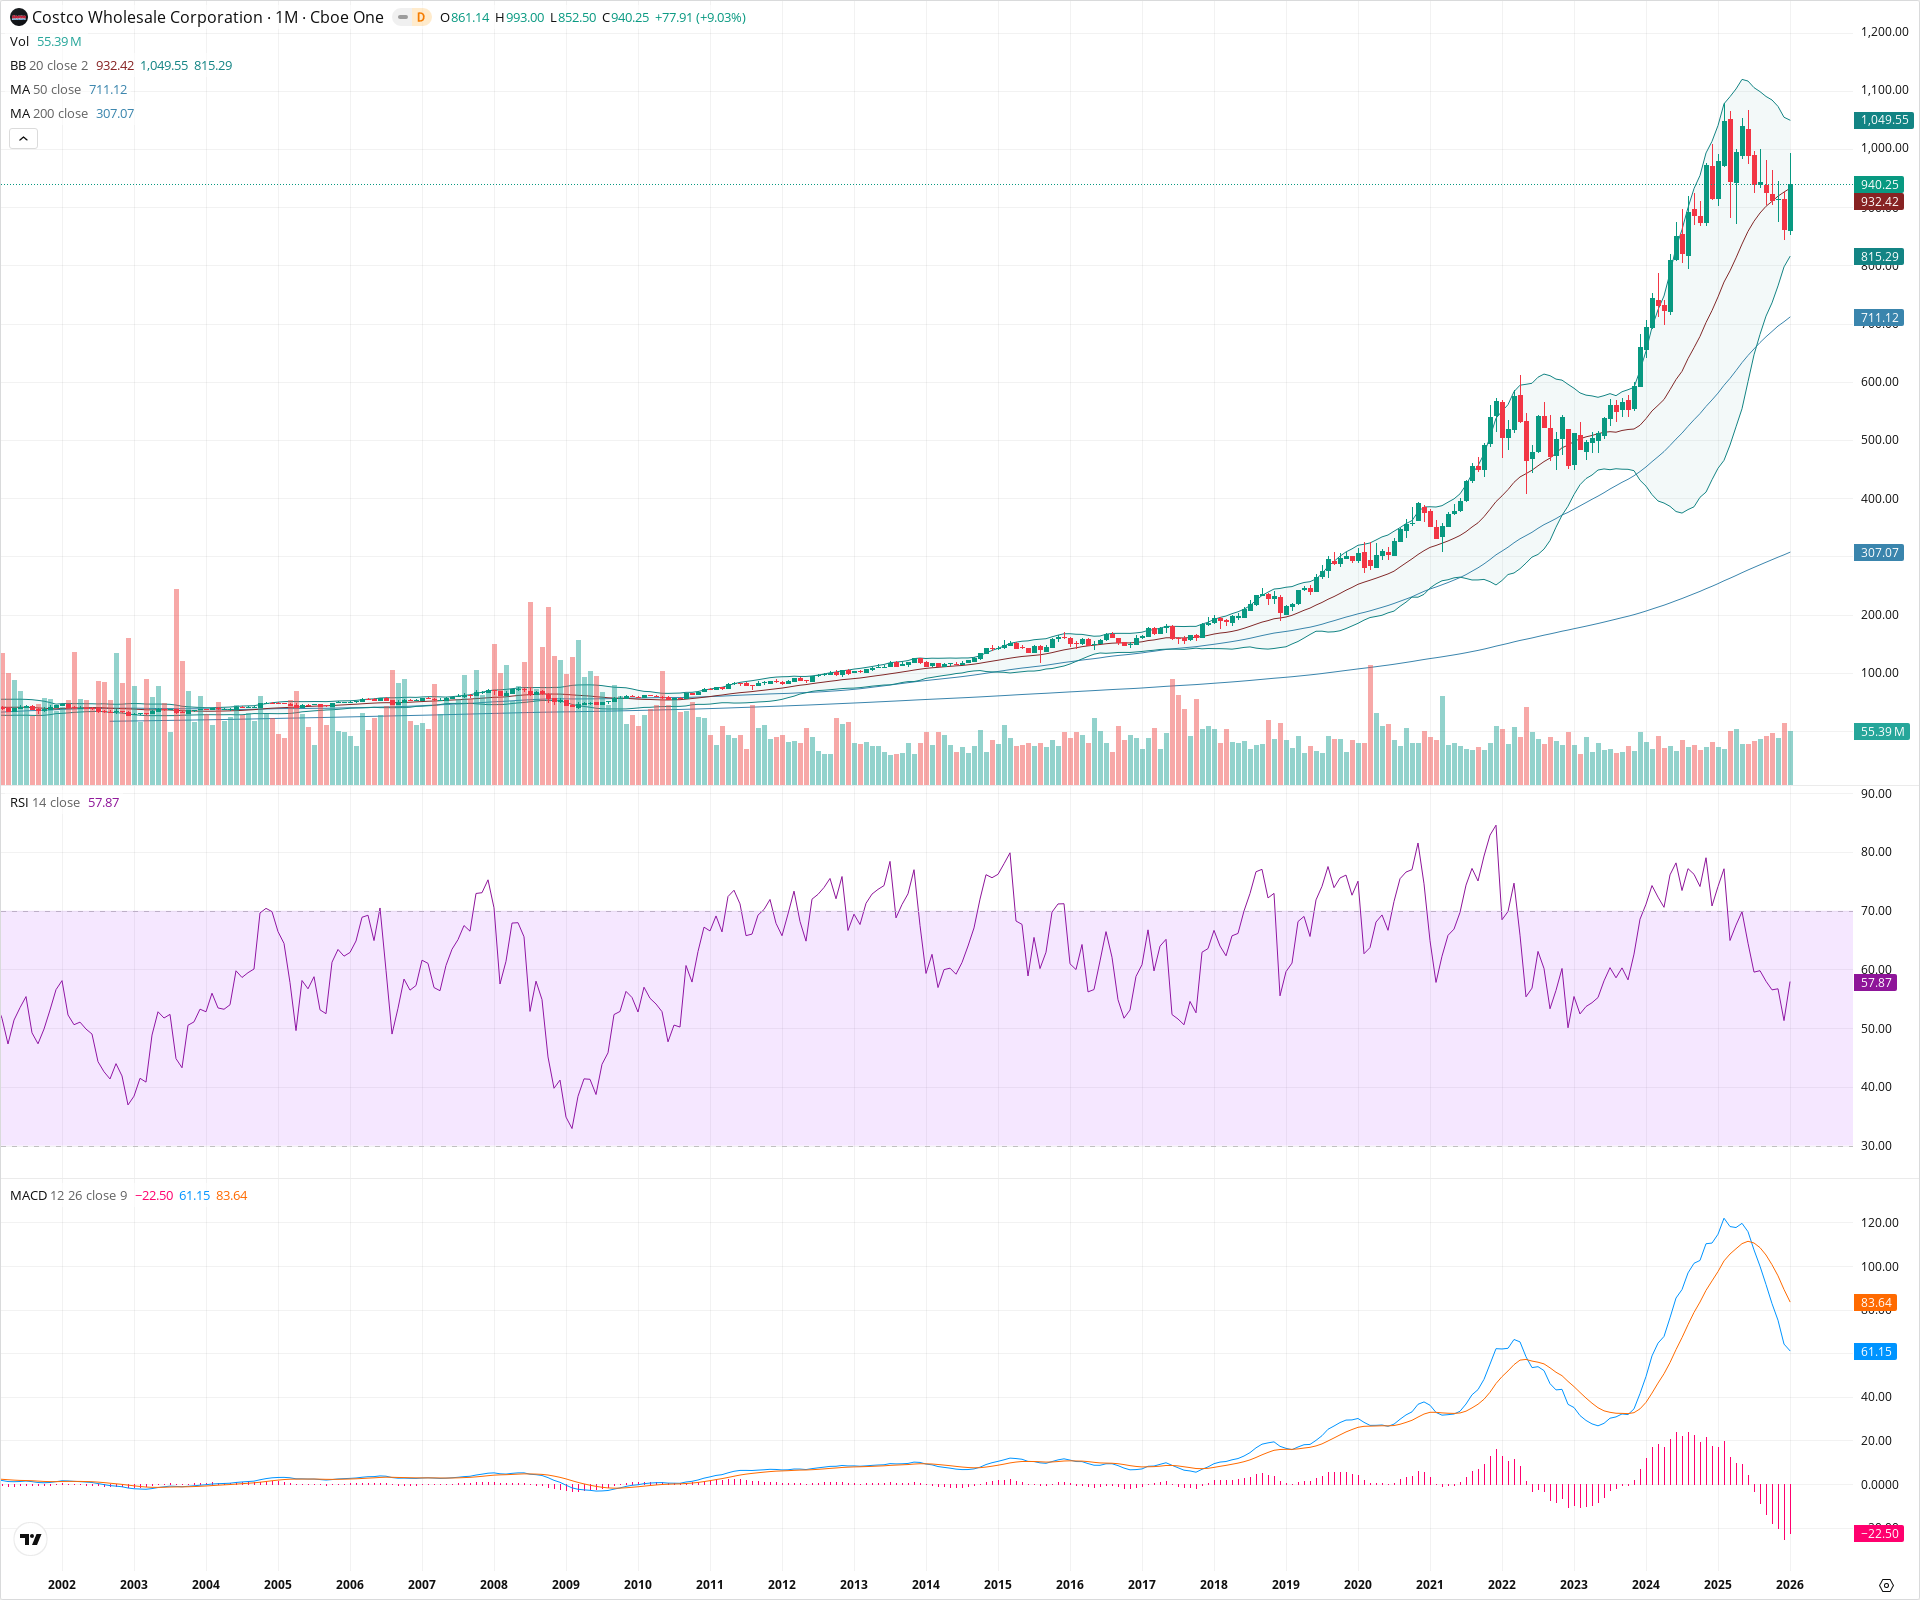
COST Monthly Chart
Sentiment
Short-term Sentiment (days to weeks): Neutral
Price is consolidating after a strong run, currently testing the 20-month SMA as support. A bearish MACD crossover and negative histogram suggest momentum is cooling significantly in the near term.
Long-term Sentiment (weeks to months): Bullish
The stock remains in a definitive secular uptrend, trading well above the rising 50-month and 200-month SMAs. The structural sequence of higher highs and higher lows on the monthly timeframe is intact.
Report Metadata
- Timeframe: monthly
- Generated at: 2026-02-02T05:30:57.269Z
- Model: gemini-3-pro-preview
Support Price Levels
| Level | Range | Strength | Notes |
|---|---|---|---|
| $932.50 | $930.00 - $935.00 | Weak | Immediate dynamic support at the 20-month SMA (approx 932.42). |
| $807.50 | $800.00 - $815.00 | Strong | Confluence of the Lower Bollinger Band (815.29) and prior consolidation zone around the 800 psychological level. |
| $707.50 | $700.00 - $715.00 | Strong | Major structural support aligned with the 50-month SMA (711.12). |
Resistance Price Levels
| Level | Range | Strength | Notes |
|---|---|---|---|
| $995.00 | $990.00 - $1,000.00 | Strong | Recent all-time high (993.00) and psychological round number. |
| $1,050.00 | $1,045.00 - $1,055.00 | Weak | Upper Bollinger Band projection (approx 1049.55). |
Potential Chart Patterns in Formation
| Strength | Pattern | Signal | Target | Details |
|---|---|---|---|---|
| Strong | Secular Bull Trend | Bullish | N/A | A persistent multi-year uptrend characterized by parabolic price expansion away from the 50-month SMA. |
| Moderate | Momentum Consolidation | Neutral | N/A | MACD has crossed bearishly below the signal line with a negative histogram, indicating a pause or digestion of the recent parabolic move. |
Frequently Asked Questions about COST
What is the current sentiment for COST?
The short-term sentiment for COST is currently Neutral because Price is consolidating after a strong run, currently testing the 20-month SMA as support. A bearish MACD crossover and negative histogram suggest momentum is cooling significantly in the near term.. The long-term trend is classified as Bullish.
What are the key support levels for COST?
StockDips.AI has identified key support levels for COST at $932.50 and $807.50. These levels may represent potential accumulation zones where buying interest could emerge.
Is COST in a significant dip or a Value Dip right now?
COST has a Value Score of 58/100. It is not currently flagged as a significant dip in the Top Dips list. It is not listed as a Value Dip because the long-term sentiment or value-score threshold does not qualify.
View the full interactive analysis on StockDips.AI.