CRWV Monthly Technical Analysis
CoreWeave Inc
A specialized cloud provider for GPU-intensive computing, particularly for artificial intelligence (AI) and machine learning applications.
CRWV Technical Analysis Summary
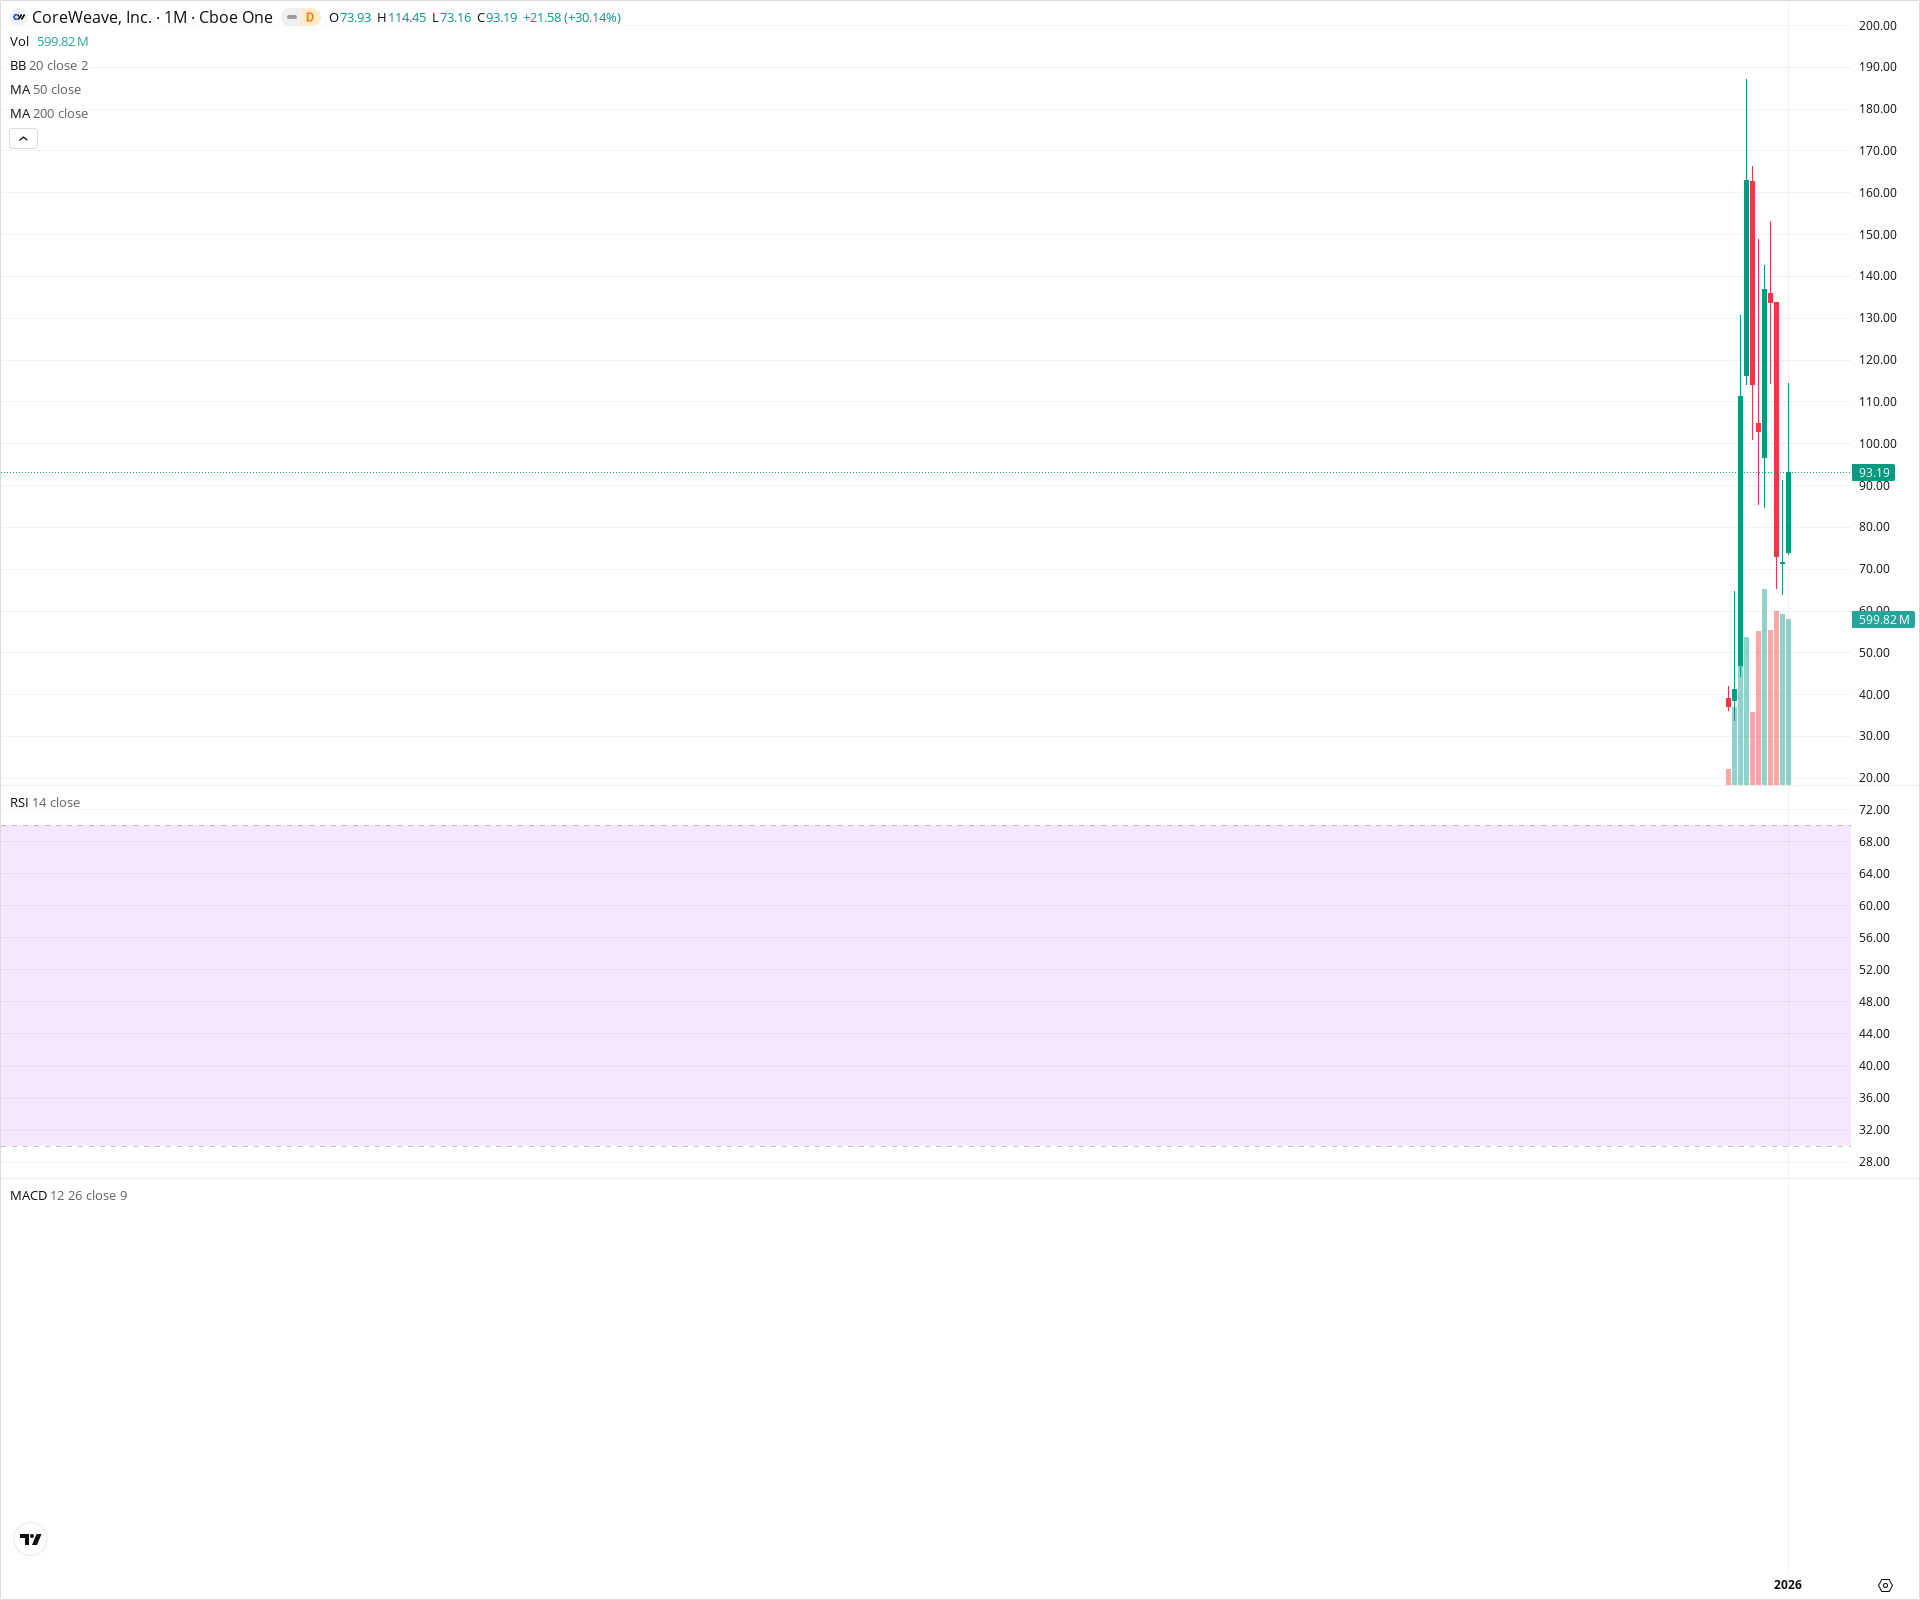
CRWV is in a high-volatility price discovery mode, having surged vertically from its initial base. The current monthly candle shows extreme bullishness with a gain of over 30%, though the upper wick indicates some rejection at the 114.45 all-time high. Due to the limited trading history, standard oscillators like RSI and MACD have not yet formed valid signals, making price action the sole primary indicator.
Included In Lists
Related Tickers of Interest
CRWV Monthly Chart
Sentiment
Short-term Sentiment (days to weeks): Bullish
The stock is up over 30% in the current month with strong momentum, trading well above the previous month's high, indicating aggressive buying interest despite a pullback from intraday highs.
Long-term Sentiment (weeks to months): Bullish
Price action is in a vertical discovery phase, breaking out of an initial consolidation base around the 40-60 level. There is no overhead resistance prior to the current month's high.
Report Metadata
- Timeframe: monthly
- Generated at: 2026-02-02T05:31:16.644Z
- Model: gemini-3-pro-preview
Support Price Levels
| Level | Range | Strength | Notes |
|---|---|---|---|
| $73.50 | $73.00 - $74.00 | Strong | Corresponds to the low and open of the current explosive monthly candle; immediate structural support. |
| $55.00 | $50.00 - $60.00 | Strong | Major consolidation zone and breakout level prior to the current parabolic move. |
Resistance Price Levels
| Level | Range | Strength | Notes |
|---|---|---|---|
| $114.45 | $114.45 - $114.45 | Strong | The all-time high set during the current month; serves as the primary ceiling for price discovery. |
Potential Chart Patterns in Formation
| Strength | Pattern | Signal | Target | Details |
|---|---|---|---|---|
| Strong | Parabolic Breakout | Bullish | N/A | A vertical price move escaping the initial trading range, characterized by large ranging candles and high volume. |
Frequently Asked Questions about CRWV
What is the current sentiment for CRWV?
The short-term sentiment for CRWV is currently Bullish because The stock is up over 30% in the current month with strong momentum, trading well above the previous month's high, indicating aggressive buying interest despite a pullback from intraday highs.. The long-term trend is classified as Bullish.
What are the key support levels for CRWV?
StockDips.AI has identified key support levels for CRWV at $73.50 and $55.00. These levels may represent potential accumulation zones where buying interest could emerge.
Is CRWV in a significant dip or a Value Dip right now?
CRWV has a Value Score of 56/100. It is not currently flagged as a significant dip in the Top Dips list. It is not listed as a Value Dip because the long-term sentiment or value-score threshold does not qualify.
View the full interactive analysis on StockDips.AI.