DIS Monthly Technical Analysis
Walt Disney Co.
Entertainment company with movies, TV, theme parks, and the Disney+ streaming service.
DIS Technical Analysis Summary
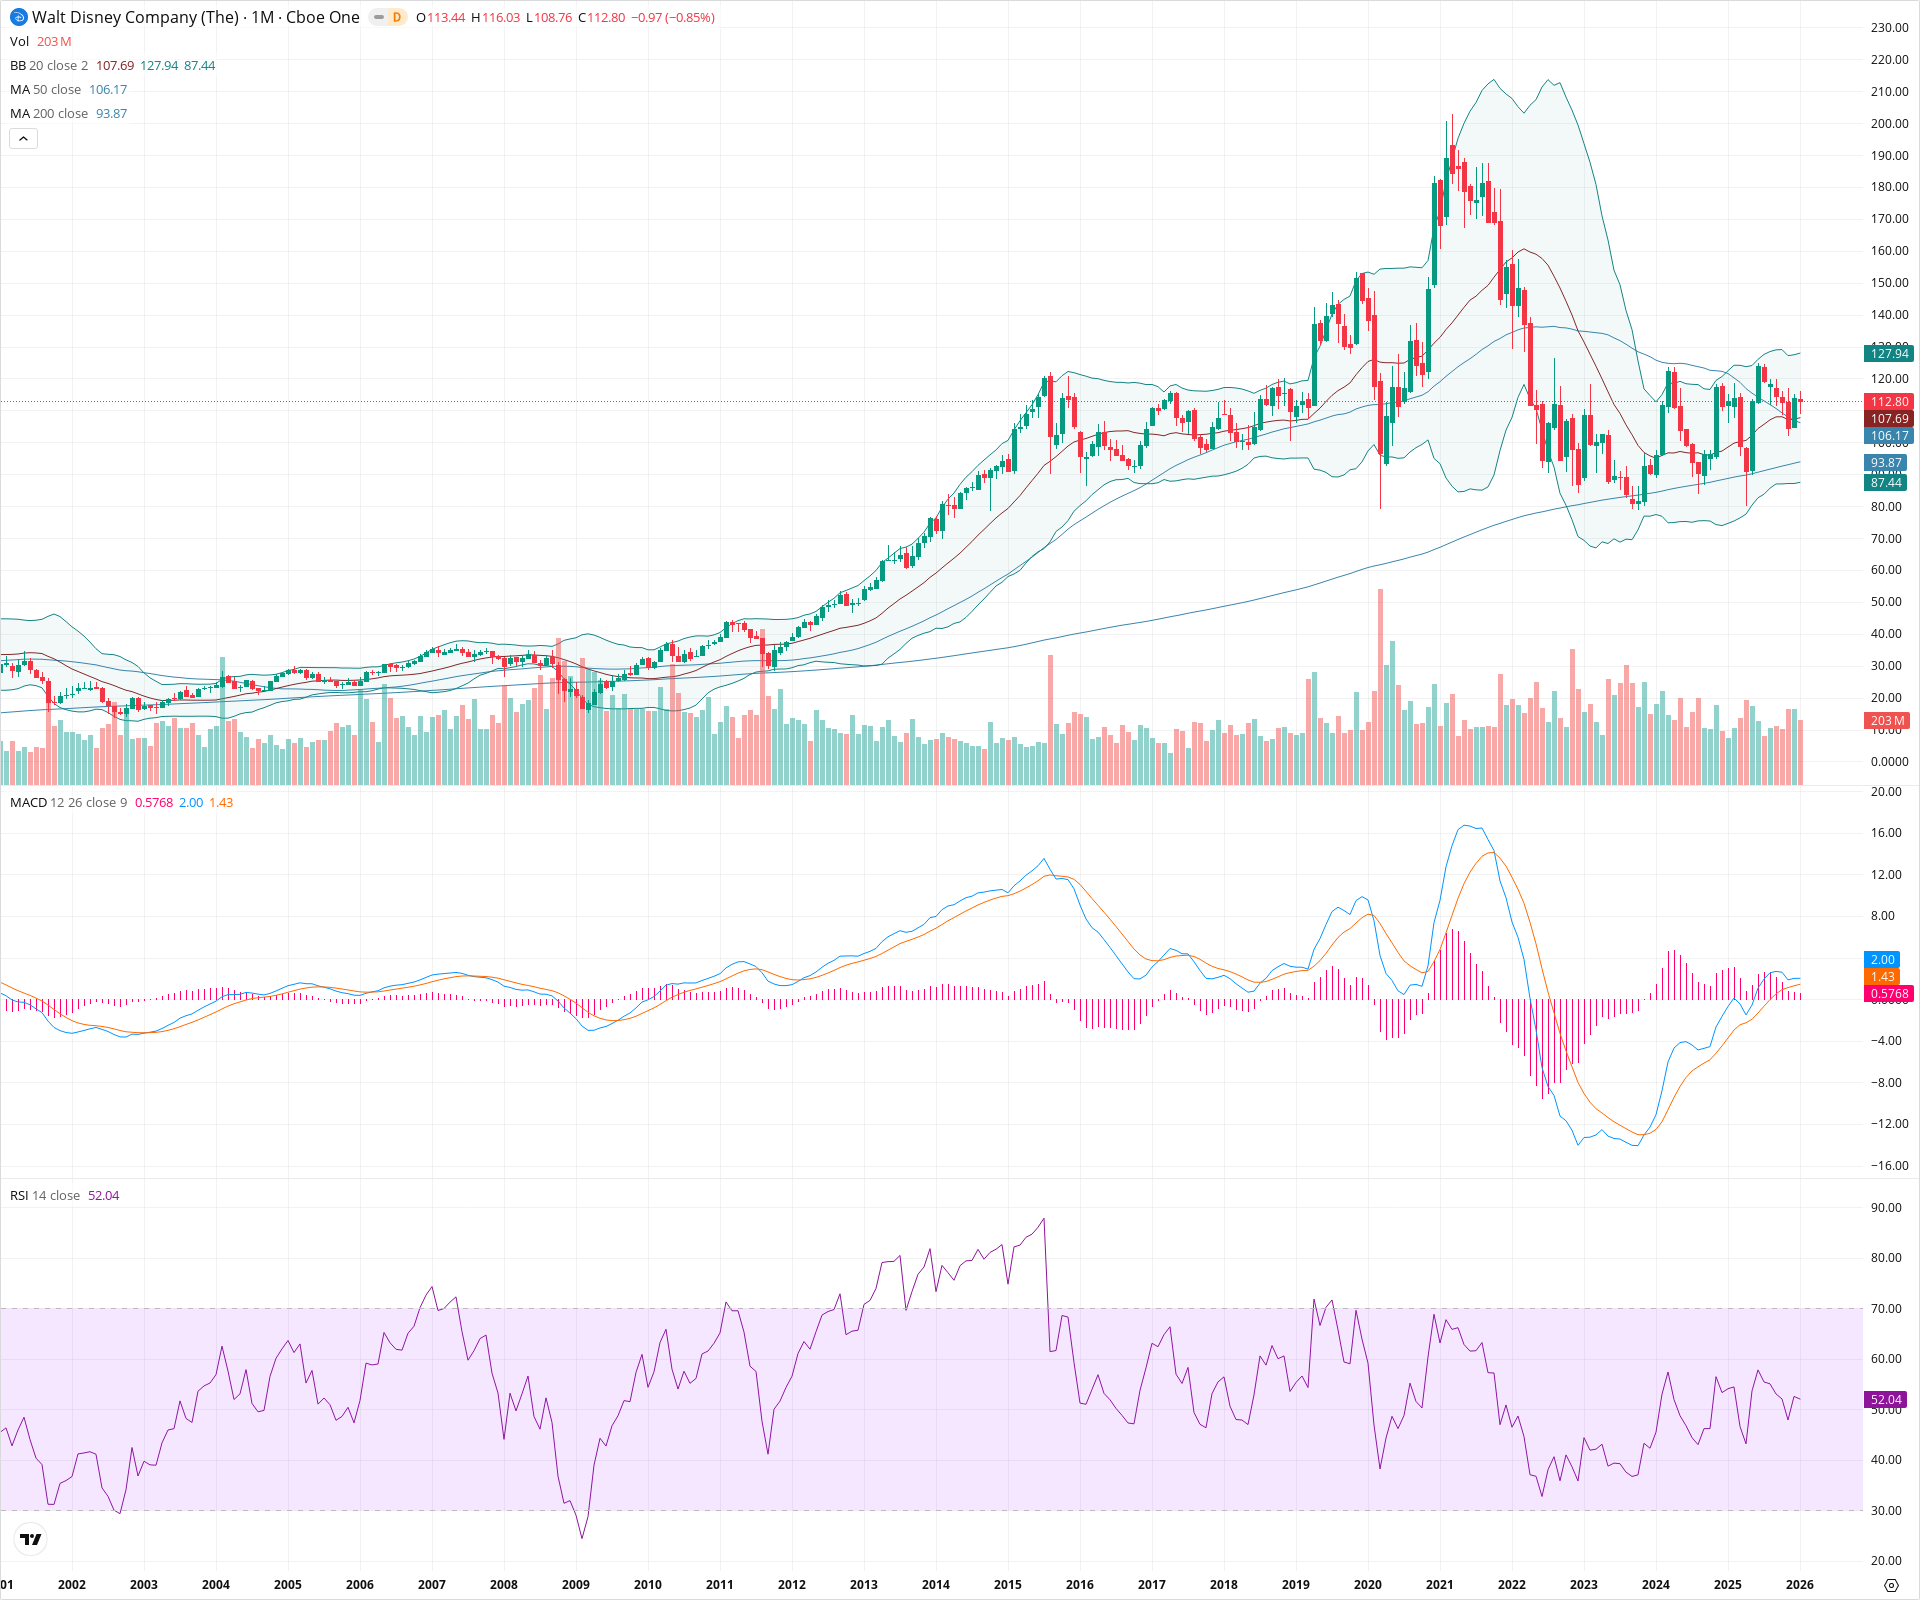
The technical picture for Disney has improved significantly on the monthly timeframe, with price action reclaiming the key 20, 50, and 200-month moving averages after a prolonged downtrend. A clear double bottom base around $80 suggests a major secular low is in place, supported by RSI rising above 50 and a bullish MACD crossover. The stock is poised for a continued recovery, with the next major test likely at the upper Bollinger Band near $128.
Included In Lists
Related Tickers of Interest
DIS Monthly Chart
Sentiment
Short-term Sentiment (days to weeks): Bullish
Price is trading above the 20 and 50-month SMAs, and the MACD histogram is positive and expanding, indicating building upward momentum despite the current month's minor pullback.
Long-term Sentiment (weeks to months): Bullish
The stock has successfully reclaimed the 200-month SMA ($93.87), a critical long-term trend divider. A potential long-term bottom has formed around the $80 level, supported by a bullish MACD crossover.
Report Metadata
- Timeframe: monthly
- Generated at: 2026-02-02T06:23:02.210Z
- Model: gemini-3-pro-preview
Support Price Levels
| Level | Range | Strength | Notes |
|---|---|---|---|
| $106.93 | $106.17 - $107.69 | Strong | Confluence of the 20-month and 50-month SMAs acting as immediate dynamic support. |
| $94.44 | $93.87 - $95.00 | Strong | The 200-month SMA, a major secular trend indicator. |
| $81.50 | $79.00 - $84.00 | Strong | Multi-year structural low and double bottom base formed in 2022/2023. |
Resistance Price Levels
| Level | Range | Strength | Notes |
|---|---|---|---|
| $128.97 | $127.94 - $130.00 | Weak | Upper Bollinger Band and psychological round number. |
| $152.50 | $150.00 - $155.00 | Strong | Significant historical pivot zone; previous resistance in 2015-2019 and breakdown level in 2022. |
| $201.50 | $200.00 - $203.00 | Strong | All-time high region established in 2021. |
Potential Chart Patterns in Formation
| Strength | Pattern | Signal | Target | Details |
|---|---|---|---|---|
| Strong | Double Bottom | Bullish | $150.00 | A large W-shaped reversal pattern with lows near $79-$84 formed over 2022 and 2023. |
Frequently Asked Questions about DIS
What is the current sentiment for DIS?
The short-term sentiment for DIS is currently Bullish because Price is trading above the 20 and 50-month SMAs, and the MACD histogram is positive and expanding, indicating building upward momentum despite the current month's minor pullback.. The long-term trend is classified as Bullish.
What are the key support levels for DIS?
StockDips.AI has identified key support levels for DIS at $106.93 and $94.44. These levels may represent potential accumulation zones where buying interest could emerge.
Is DIS in a significant dip or a Value Dip right now?
DIS has a Value Score of 54/100. It is not currently flagged as a significant dip in the Top Dips list. It is not listed as a Value Dip because the long-term sentiment or value-score threshold does not qualify.
View the full interactive analysis on StockDips.AI.