INTC Weekly Technical Analysis
Intel Corporation
Semiconductor company producing CPUs and data center products.
INTC Technical Analysis Summary
INTC is currently experiencing a violent mean reversion following a massive, multi-year parabolic breakout. Short-term momentum is decisively bearish as price slices through initial support levels, confirmed by a negative MACD crossover and plunging RSI. However, the macro trend remains structurally bullish; long-term investors should watch for potential stabilization and basing as price approaches the rising 50-week moving average.
Included In Lists
Related Tickers of Interest
INTC Weekly Chart
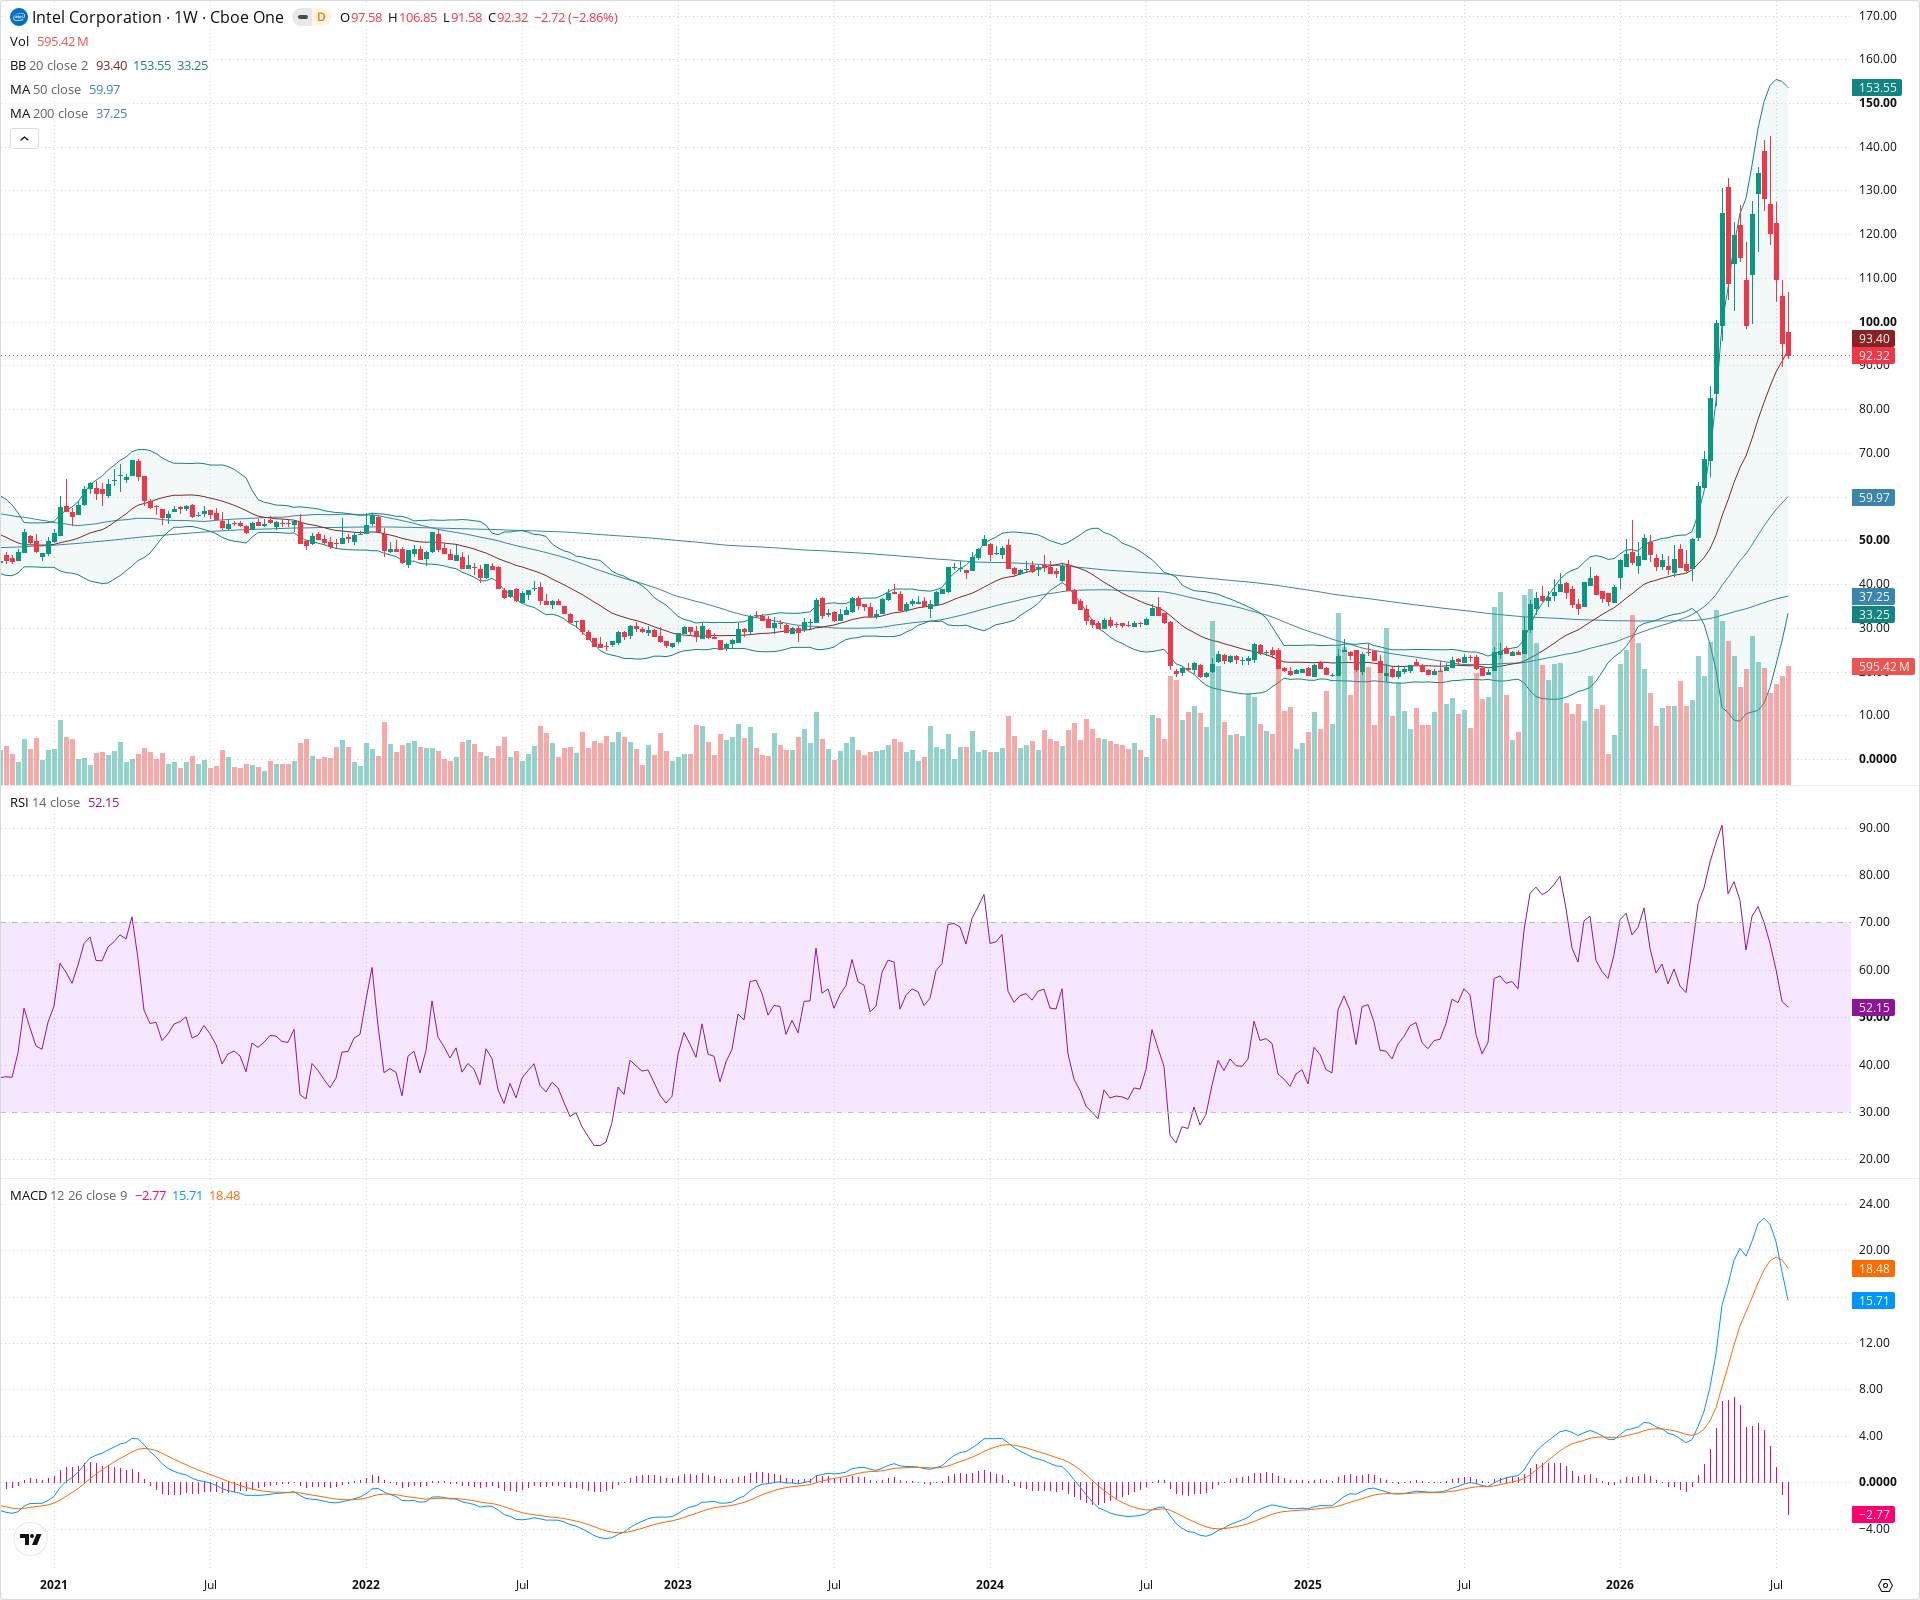
Sentiment
Short-term Sentiment (days to weeks): Bearish
Price is undergoing a severe correction from a parabolic high, marked by multiple large red weekly candles. It has just closed below the 20-week SMA, RSI is pointing sharply downwards away from overbought levels, and MACD has generated a bearish crossover with a growing negative histogram.
Long-term Sentiment (weeks to months): Bullish
Despite the violent short-term pullback, the long-term macro structure remains intact. The 50-week SMA is trending strongly upward and is positioned well above a rising 200-week SMA. The current price remains significantly above these major long-term moving averages.
Report Metadata
- Timeframe: weekly
- Generated at: 2026-07-25T09:05:33.198Z
- Model: gemini-3.1-pro-preview
Support Price Levels
| Level | Range | Strength | Notes |
|---|---|---|---|
| $75.00 | $70.00 - $80.00 | Weak | Previous structural consolidation zone before the final parabolic advance. May provide temporary hesitation, but vulnerable given current downward momentum. |
| $60.00 | $55.00 - $65.00 | Strong | Major support zone defined by the rapidly rising 50-week SMA (currently near 60) and structural pivot levels from earlier in the uptrend. |
Resistance Price Levels
| Level | Range | Strength | Notes |
|---|---|---|---|
| $115.00 | $110.00 - $120.00 | Strong | Zone where the recent breakdown accelerated; likely to act as significant overhead supply on any relief rallies. |
| $142.50 | $135.00 - $150.00 | Strong | The massive blow-off top formation zone representing peak historical resistance. |
Potential Chart Patterns in Formation
| Strength | Pattern | Signal | Target | Details |
|---|---|---|---|---|
| Strong | Parabolic Blow-off Top Reversal | Bearish | N/A | After an unsustainable vertical ascent to roughly 150, the price has sharply reversed, characterized by large expanding range down candles, indicating a period of severe mean reversion. |
| Strong | Loss of 20-Week SMA Support | Bearish | N/A | The weekly close below the 20-week SMA (middle Bollinger Band) indicates a shift in regime from a strong uptrend to an active correction phase. |
Frequently Asked Questions about INTC
What is the current sentiment for INTC?
The short-term sentiment for INTC is currently Bearish because Price is undergoing a severe correction from a parabolic high, marked by multiple large red weekly candles. It has just closed below the 20-week SMA, RSI is pointing sharply downwards away from overbought levels, and MACD has generated a bearish crossover with a growing negative histogram.. The long-term trend is classified as Bullish.
What are the key support levels for INTC?
StockDips.AI has identified key support levels for INTC at $75.00 and $60.00. These levels may represent potential accumulation zones where buying interest could emerge.
Is INTC in a significant dip or a Value Dip right now?
INTC has a Value Score of 52/100. It is not currently flagged as a significant dip in the Top Dips list. It is not listed as a Value Dip because the long-term sentiment or value-score threshold does not qualify.
View the full interactive analysis on StockDips.AI.