INTC Monthly Technical Analysis
Intel Corporation
Semiconductor company producing CPUs and data center products.
INTC Technical Analysis Summary
Intel Corporation shows a decisive structural turnaround on the monthly timeframe, having broken out from a multi-year base and reclaimed key long-term moving averages. The price action is supported by strong momentum indicators, with the MACD entering positive territory and the RSI confirming a bullish regime without being critically overbought. While the current candle's upper wick suggests some profit-taking near 55, the long-term trend has shifted to positive as long as price holds above the 33-35 support zone.
Included In Lists
Related Tickers of Interest
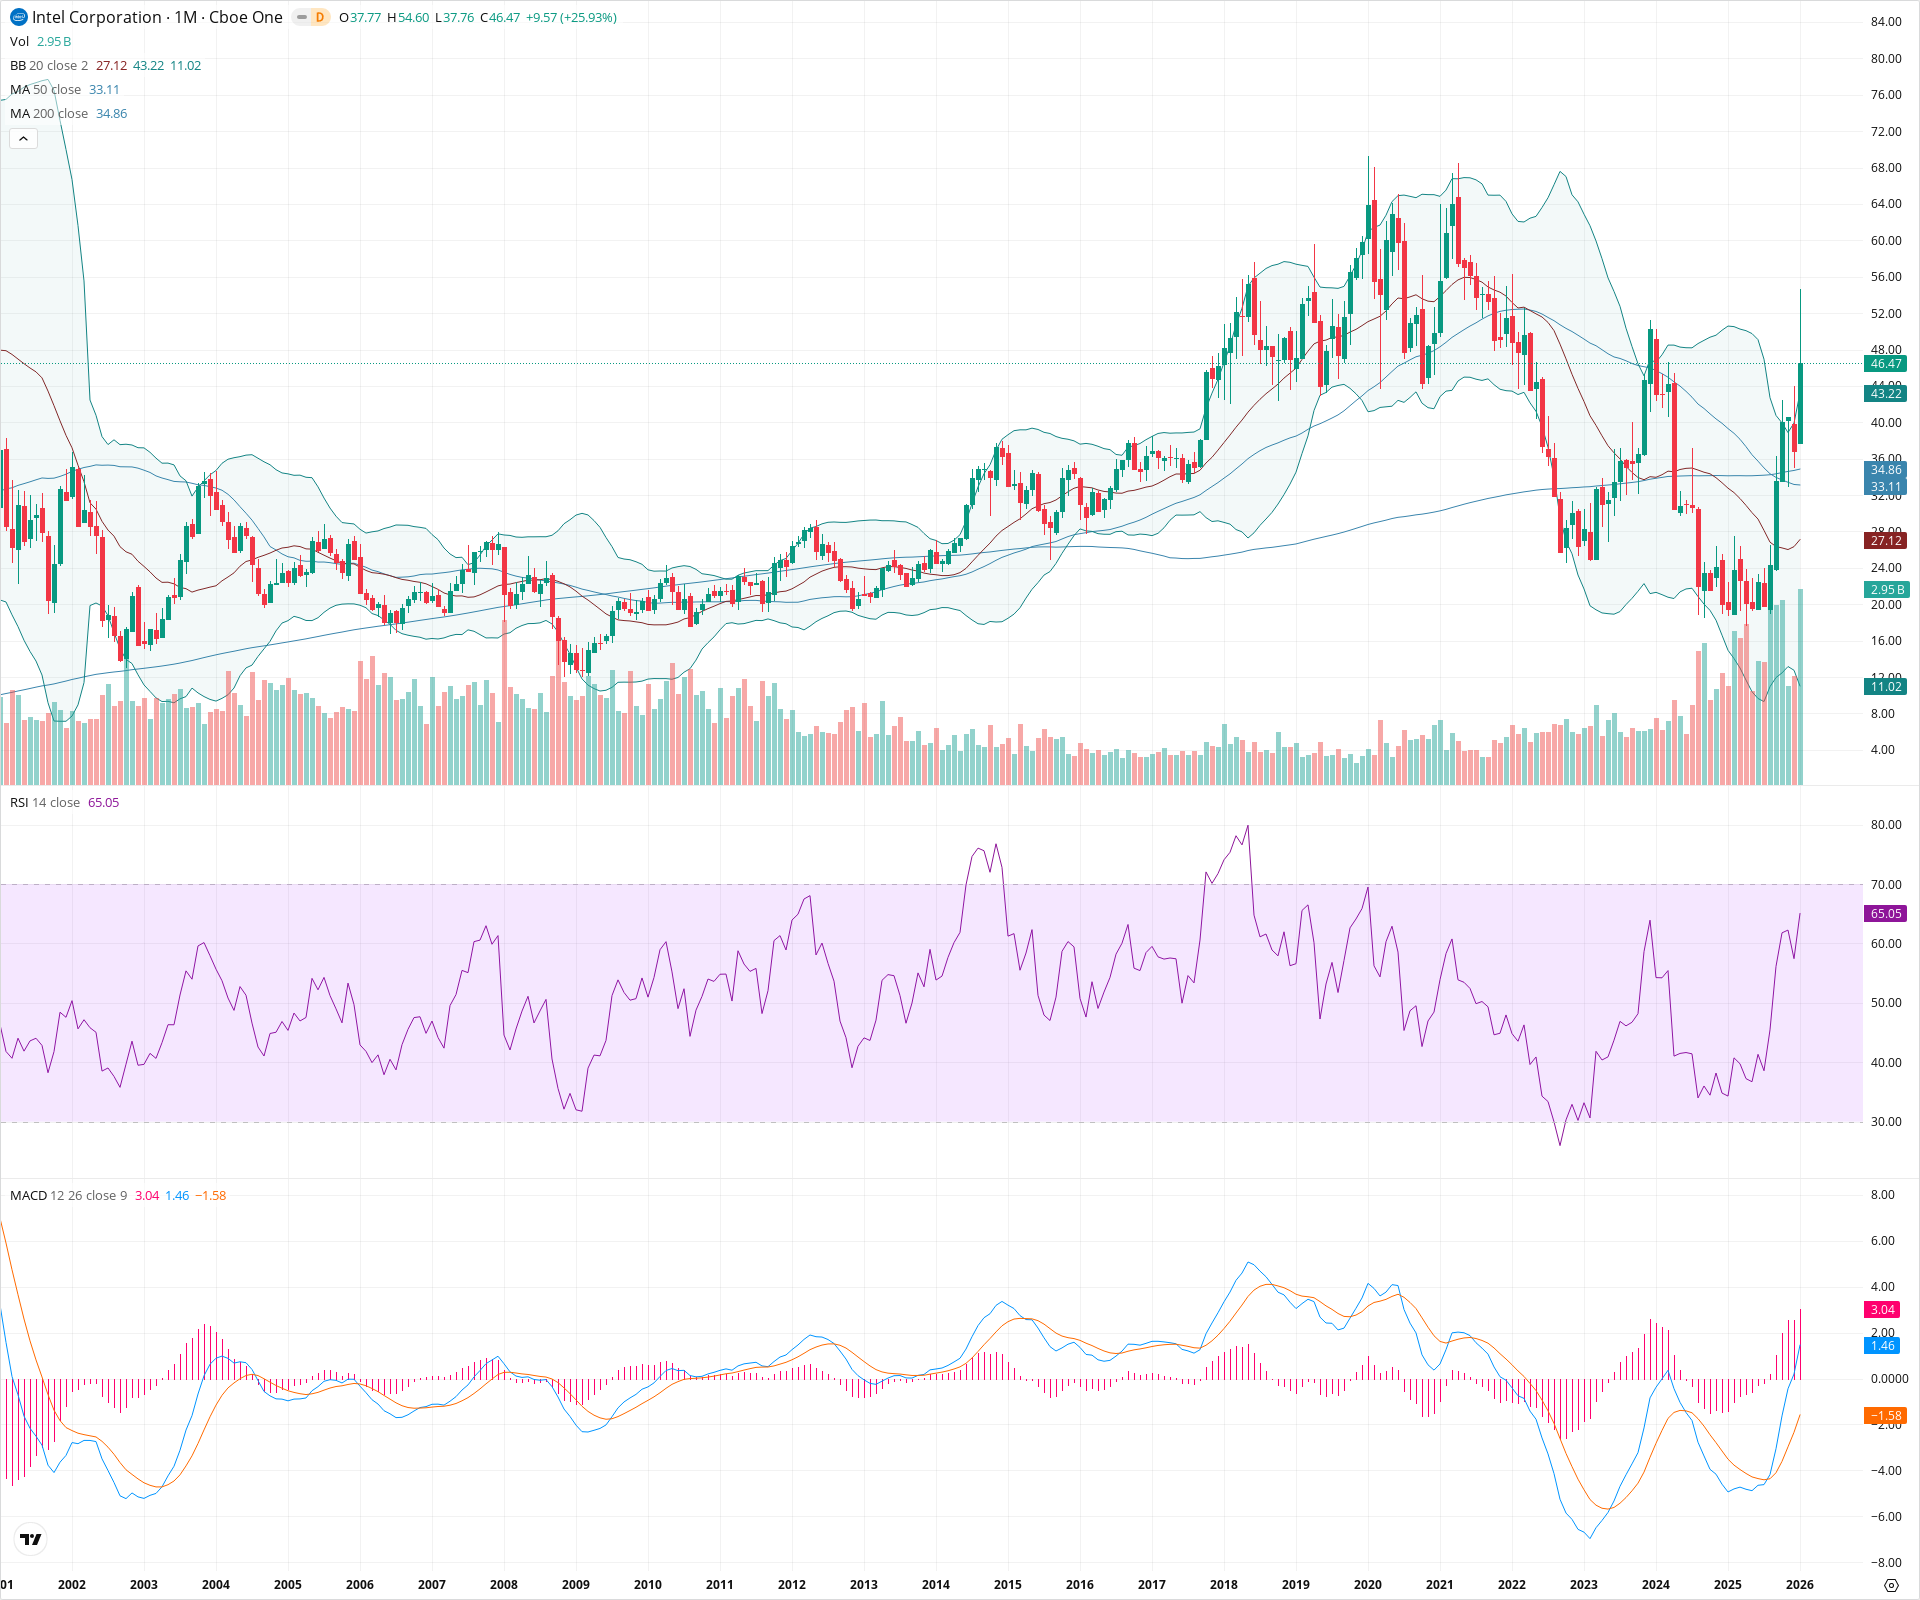
INTC Monthly Chart
Sentiment
Short-term Sentiment (days to weeks): Bullish
Price has printed a massive bullish candle gaining over 25%, breaking well above the upper Bollinger Band (43.22). Momentum is strong with the RSI rising steeply to 65.05 and the MACD histogram expanding positively.
Long-term Sentiment (weeks to months): Bullish
The stock has successfully reversed a multi-year downtrend, reclaiming both the 50-month (33.11) and 200-month (34.86) SMAs. The MACD crossing above the zero line confirms a shift to a bullish long-term regime.
Report Metadata
- Timeframe: monthly
- Generated at: 2026-02-02T06:24:29.011Z
- Model: gemini-3-pro-preview
Support Price Levels
| Level | Range | Strength | Notes |
|---|---|---|---|
| $33.99 | $33.11 - $34.86 | Strong | Confluence of the 50-month and 200-month Simple Moving Averages, serving as a critical floor for the new trend. |
| $25.00 | $24.00 - $26.00 | Strong | Major secular low and base formed between 2022 and 2023. |
Resistance Price Levels
| Level | Range | Strength | Notes |
|---|---|---|---|
| $55.30 | $54.60 - $56.00 | Weak | Immediate resistance marked by the current month's high wick and historical congestion from 2018-2020. |
| $68.50 | $68.00 - $69.00 | Strong | Major multi-year cycle highs established in 2020 and 2021. |
Potential Chart Patterns in Formation
| Strength | Pattern | Signal | Target | Details |
|---|---|---|---|---|
| Strong | Rounding Bottom | Bullish | N/A | A multi-year U-shaped recovery pattern starting from the 2021 highs, bottoming in the mid-20s, and now breaking out. |
Frequently Asked Questions about INTC
What is the current sentiment for INTC?
The short-term sentiment for INTC is currently Bullish because Price has printed a massive bullish candle gaining over 25%, breaking well above the upper Bollinger Band (43.22). Momentum is strong with the RSI rising steeply to 65.05 and the MACD histogram expanding positively.. The long-term trend is classified as Bullish.
What are the key support levels for INTC?
StockDips.AI has identified key support levels for INTC at $33.99 and $25.00. These levels may represent potential accumulation zones where buying interest could emerge.
Is INTC in a significant dip or a Value Dip right now?
INTC has a Value Score of 52/100. It is not currently flagged as a significant dip in the Top Dips list. It is not listed as a Value Dip because the long-term sentiment or value-score threshold does not qualify.
View the full interactive analysis on StockDips.AI.