IREN Monthly Technical Analysis
Iris Energy Ltd
Bitcoin miner focusing on renewable energy-powered operations.
IREN Technical Analysis Summary
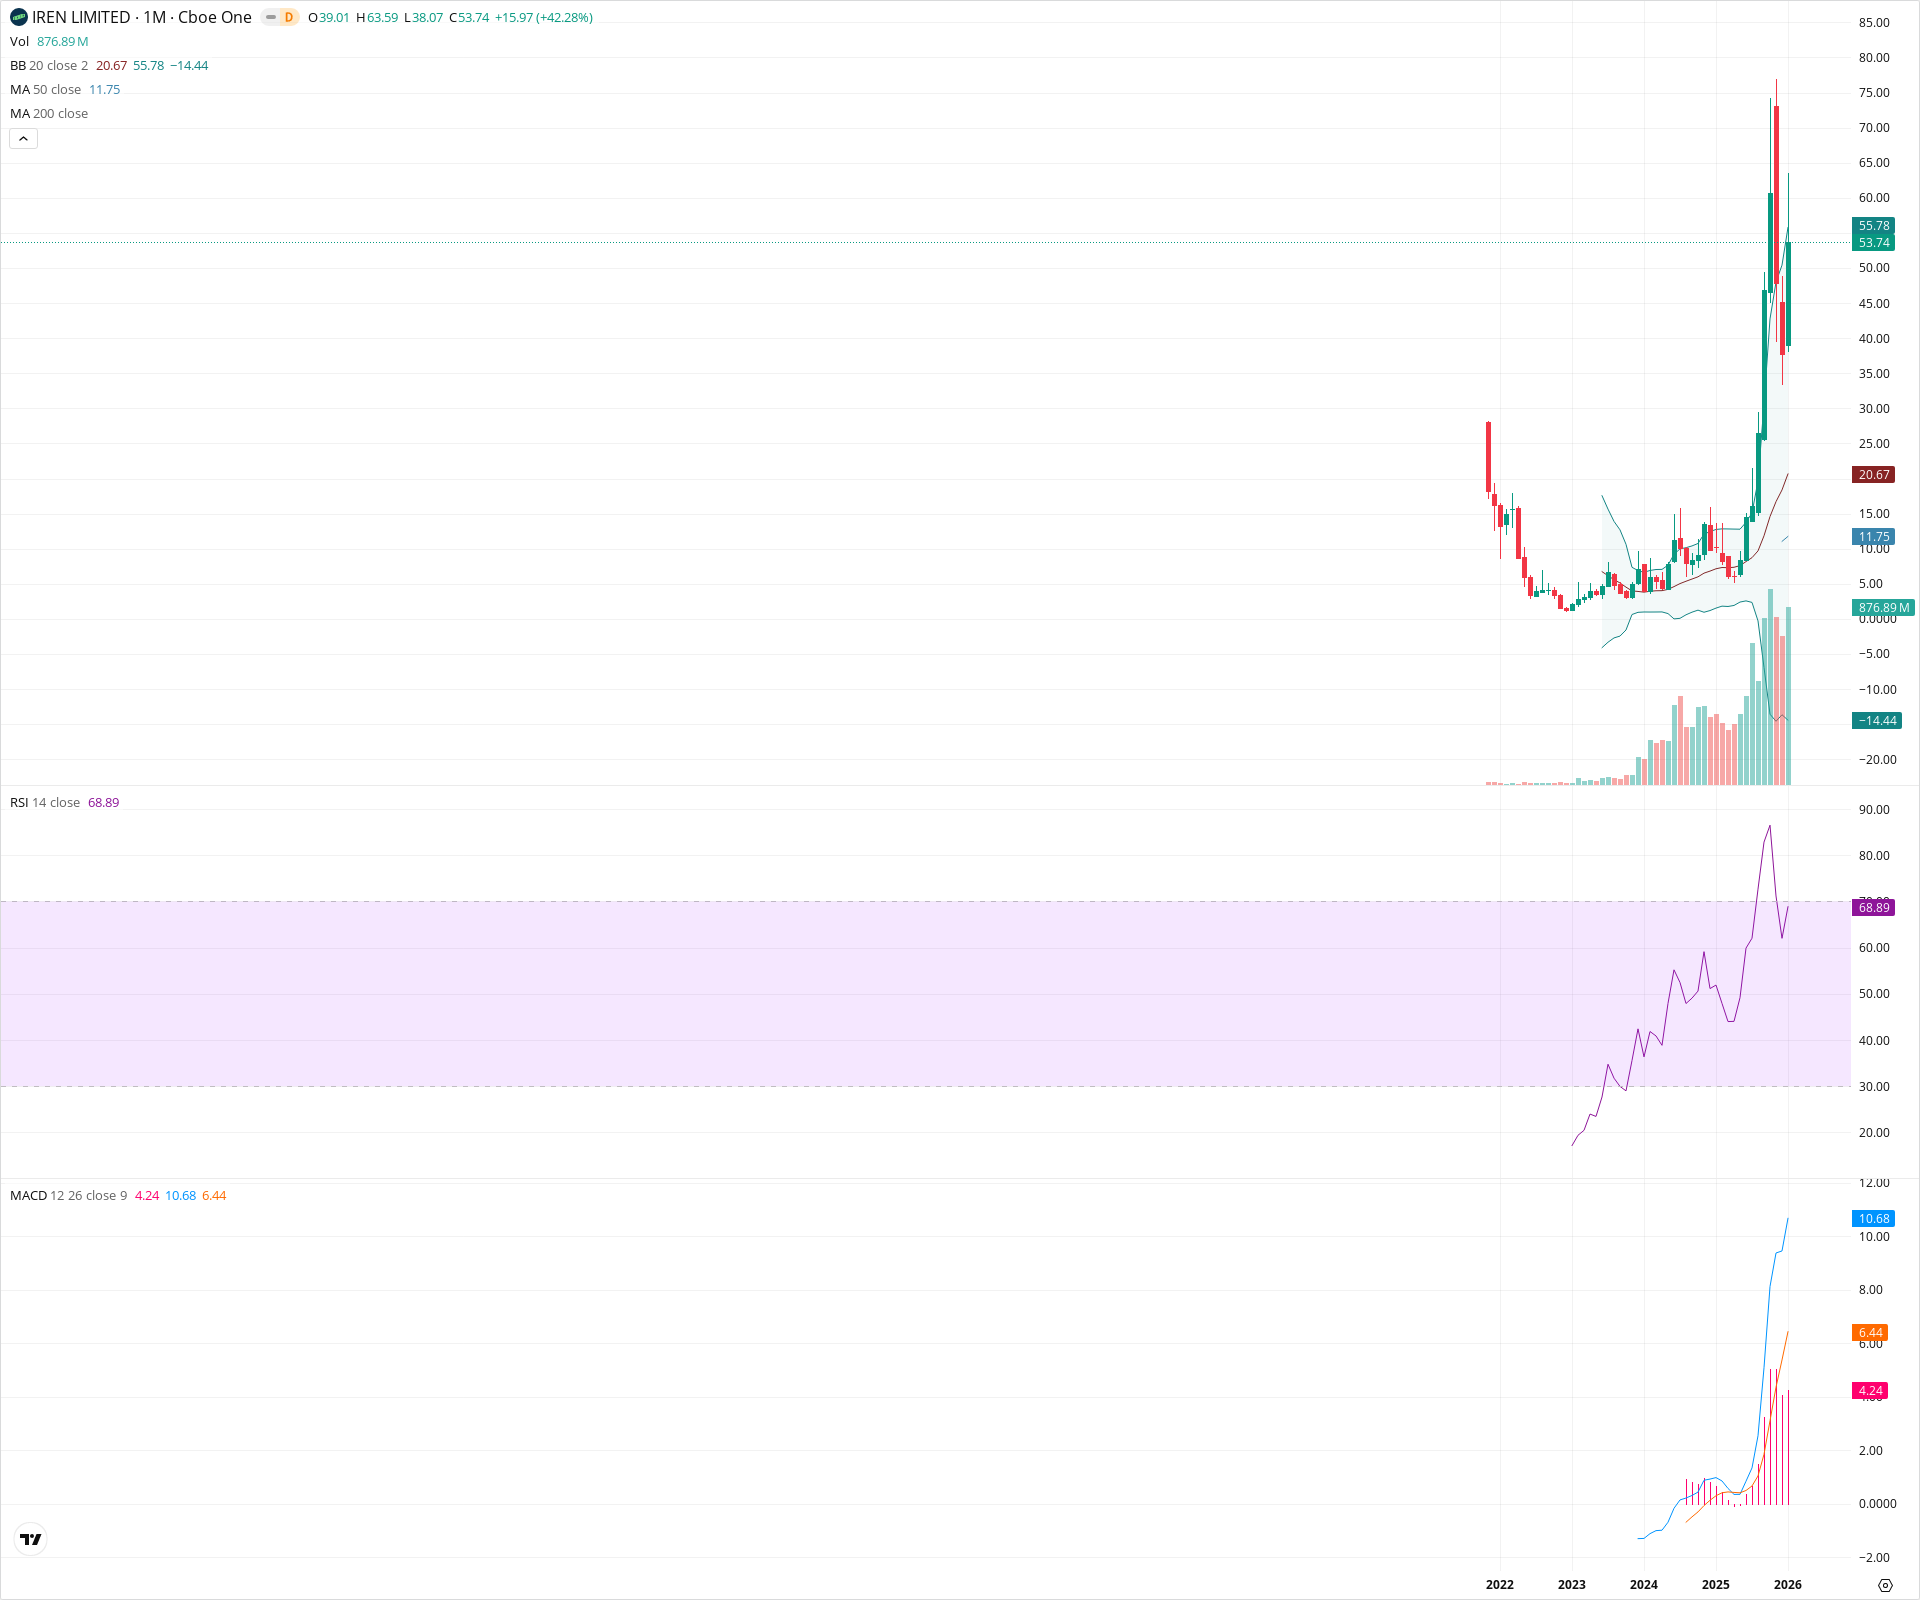
IREN is exhibiting an extremely strong parabolic breakout on the monthly timeframe, having cleared all visible historical resistance to enter price discovery. The move is supported by expanding volume and a surging MACD, though the vertical distance from the 20-month SMA suggests high volatility. Long-term structure is decisively bullish following the breakout from a multi-year rounding bottom.
Included In Lists
Related Tickers of Interest
IREN Monthly Chart
Sentiment
Short-term Sentiment (days to weeks): Bullish
Price is in a vertical parabolic uptrend with the current monthly candle showing a massive 42% gain. Momentum indicators like MACD are accelerating upwards, and volume is supporting the move.
Long-term Sentiment (weeks to months): Bullish
The stock has decisively broken out of a multi-year base structure. The 20-month SMA has turned steeply upward, and price is making new highs in a blue-sky discovery phase.
Report Metadata
- Timeframe: monthly
- Generated at: 2026-02-02T06:24:45.411Z
- Model: gemini-3-pro-preview
Support Price Levels
| Level | Range | Strength | Notes |
|---|---|---|---|
| $38.54 | $38.07 - $39.01 | Weak | Current monthly low and open; immediate support in a fast-moving trend. |
| $22.50 | $20.00 - $25.00 | Strong | Confluence of the rising 20-month SMA and previous structural highs before the parabolic extension. |
| $12.50 | $10.00 - $15.00 | Strong | Major secular breakout zone and consolidation base top. |
Resistance Price Levels
| Level | Range | Strength | Notes |
|---|---|---|---|
| $55.78 | $55.78 - $55.78 | Weak | Upper Bollinger Band level, currently acting as dynamic resistance/guide. |
| $63.59 | $63.59 - $63.59 | Strong | Current candle high and visible all-time high marker. |
| $72.50 | $70.00 - $75.00 | Weak | Psychological round number targets in price discovery. |
Potential Chart Patterns in Formation
| Strength | Pattern | Signal | Target | Details |
|---|---|---|---|---|
| Strong | Parabolic Breakout | Bullish | N/A | After a long period of consolidation (2022-2023), price has entered a vertical expansion phase characterized by expanding candles and surging volume. |
| Strong | Rounding Bottom | Bullish | N/A | A multi-year base formation from 2022 to early 2024 that successfully resolved to the upside. |
Frequently Asked Questions about IREN
What is the current sentiment for IREN?
The short-term sentiment for IREN is currently Bullish because Price is in a vertical parabolic uptrend with the current monthly candle showing a massive 42% gain. Momentum indicators like MACD are accelerating upwards, and volume is supporting the move.. The long-term trend is classified as Bullish.
What are the key support levels for IREN?
StockDips.AI has identified key support levels for IREN at $38.54 and $22.50. These levels may represent potential accumulation zones where buying interest could emerge.
Is IREN in a significant dip or a Value Dip right now?
IREN has a Value Score of 62/100. It is not currently flagged as a significant dip in the Top Dips list. It is not listed as a Value Dip because the long-term sentiment or value-score threshold does not qualify.
View the full interactive analysis on StockDips.AI.