MRVL Monthly Technical Analysis
Marvell Technology Inc
Designs semiconductors for networking, storage, and 5G infrastructure.
MRVL Technical Analysis Summary
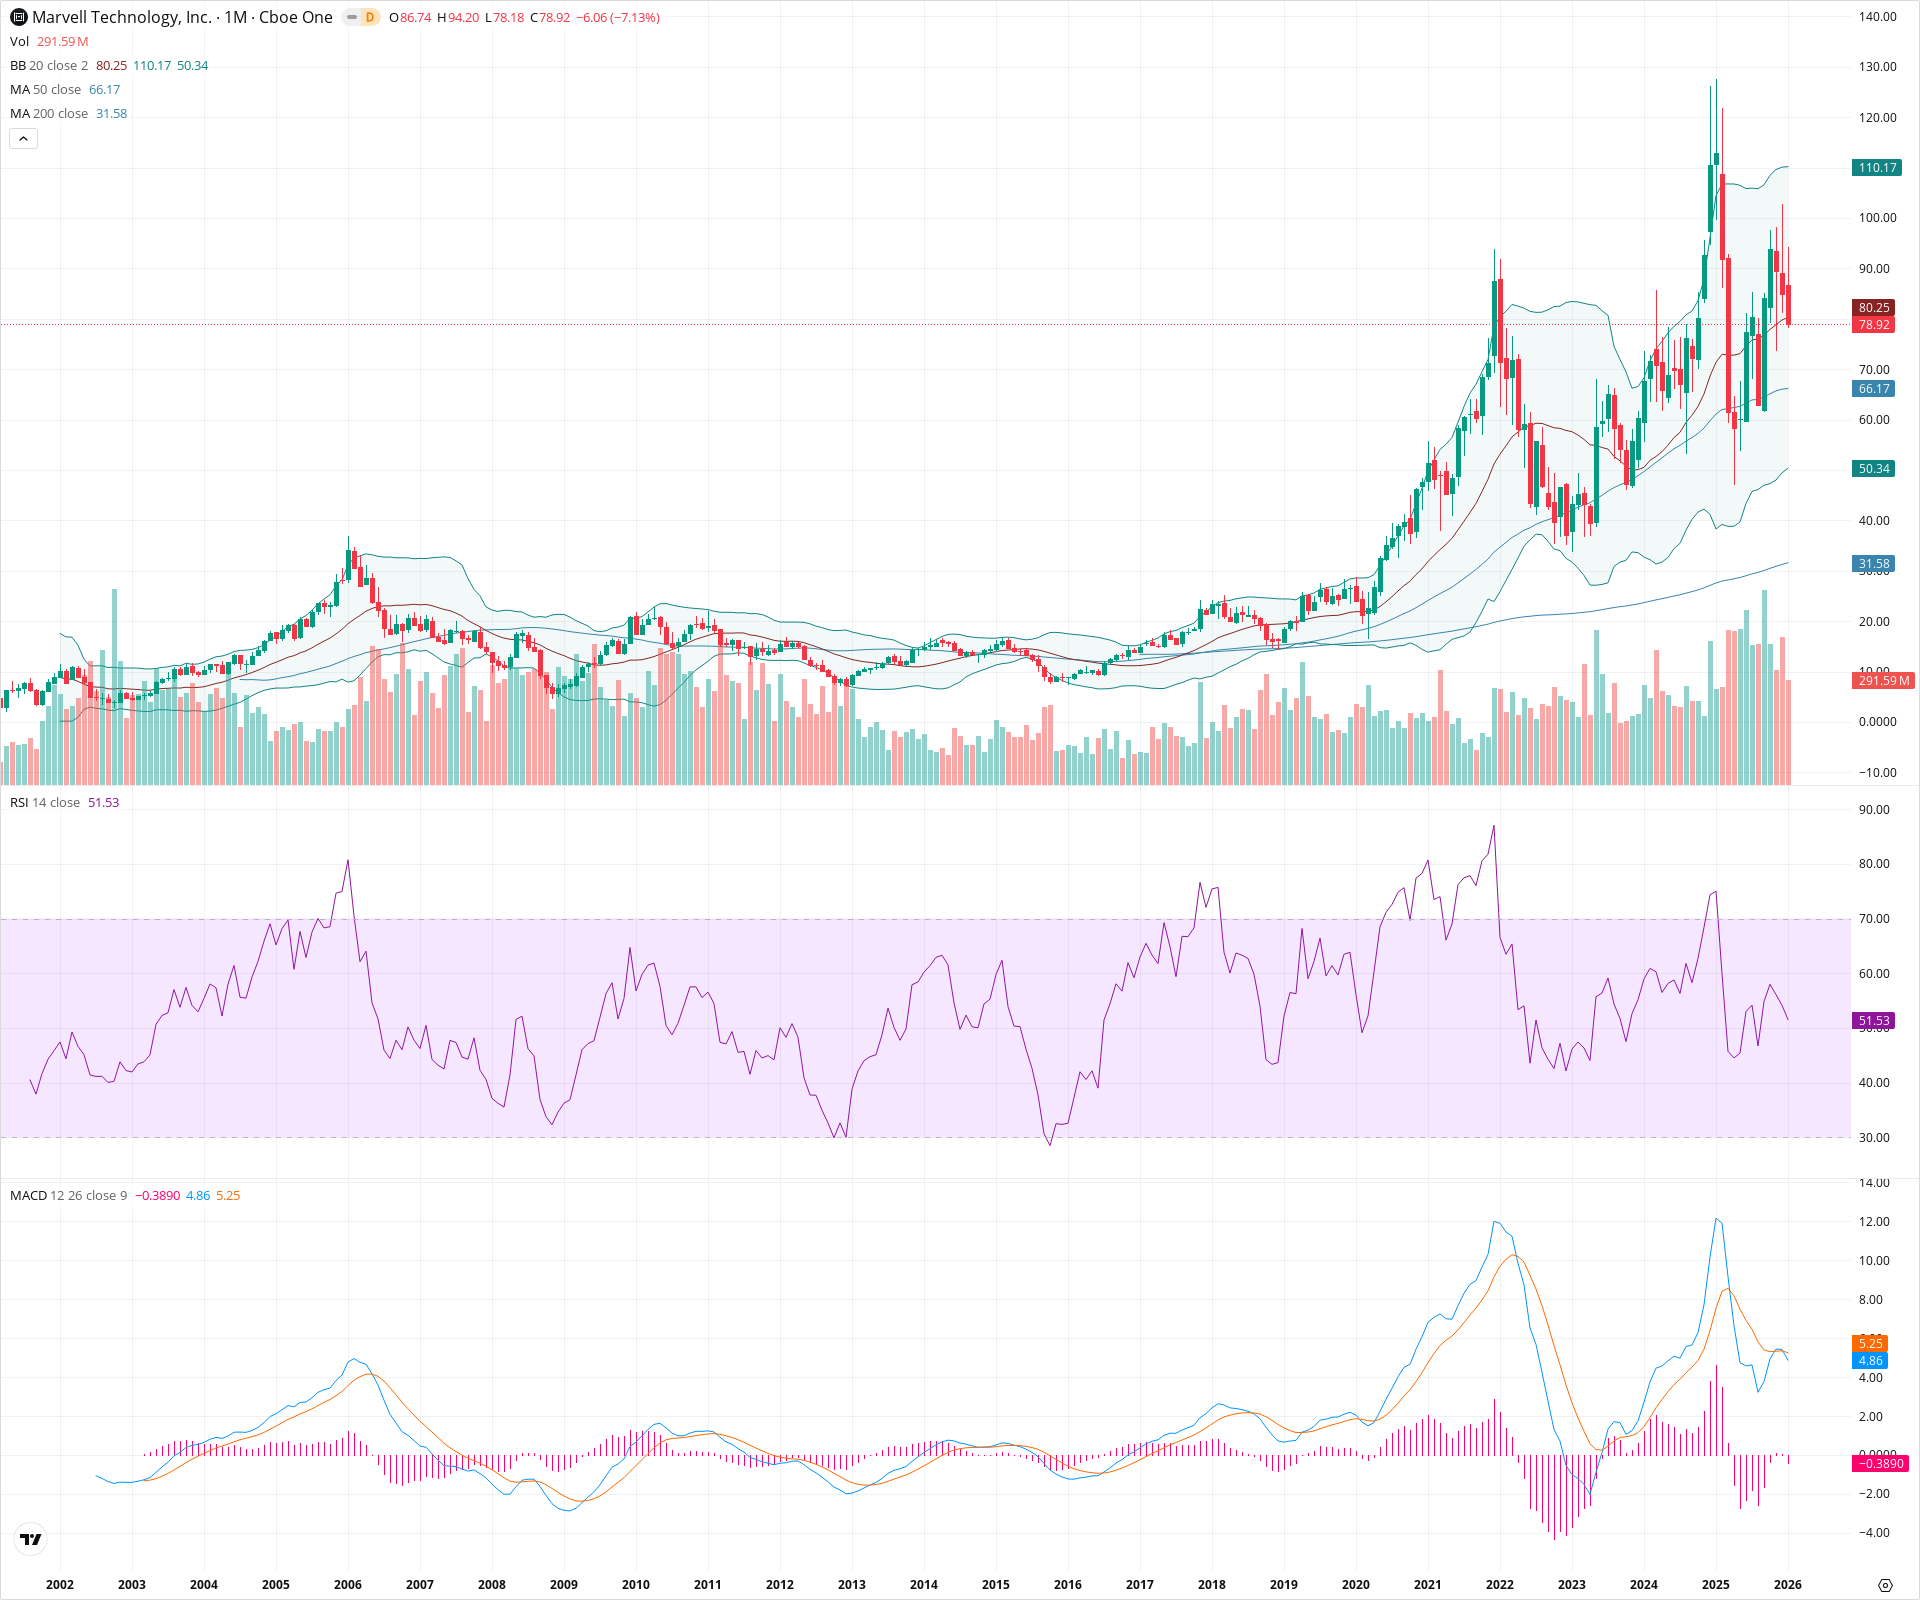
MRVL is in a long-term uptrend but is currently undergoing a momentum correction after failing to break secular resistance near $94. While the monthly MACD crossover suggests a period of cooling or pullback is likely, the underlying bullish structure remains supported by rising long-term moving averages. Investors should watch the interaction with the 50-month SMA (~$66) as a critical level for the continuation of the primary trend.
Included In Lists
Related Tickers of Interest
MRVL Monthly Chart
Sentiment
Short-term Sentiment (days to weeks): Bearish
Price has rejected off major resistance near all-time highs and closed below the 20-month SMA. The MACD displays a fresh bearish crossover with a negative histogram, and RSI is declining towards the midline, indicating momentum is shifting downward in the near term.
Long-term Sentiment (weeks to months): Bullish
The secular trend remains intact with a bullish alignment of major moving averages (20 > 50 > 200). Price is trading well above the 50-month and 200-month SMAs. The recent pullback appears to be a consolidation within a broader multi-year structural uptrend.
Report Metadata
- Timeframe: monthly
- Generated at: 2026-02-02T06:46:14.360Z
- Model: gemini-3-pro-preview
Support Price Levels
| Level | Range | Strength | Notes |
|---|---|---|---|
| $66.00 | $65.00 - $67.00 | Strong | Confluence of the rising 50-month SMA and a significant prior consolidation zone. |
| $37.50 | $35.00 - $40.00 | Strong | Major structural low from the 2022-2023 base formation. |
Resistance Price Levels
| Level | Range | Strength | Notes |
|---|---|---|---|
| $92.50 | $90.00 - $95.00 | Strong | Zone of historical all-time highs (2021 peak) and recent rejection highs (2024/2025). |
| $110.09 | $110.00 - $110.17 | Weak | Upper Bollinger Band level acting as a theoretical volatility limit. |
Potential Chart Patterns in Formation
| Strength | Pattern | Signal | Target | Details |
|---|---|---|---|---|
| Strong | Potential Cup and Handle | Bullish | N/A | A large multi-year rounded bottom (cup) formed from late 2021 to 2024. The current pullback from the highs may define the 'handle' portion of the pattern. |
| Weak | Double Top | Bearish | N/A | Price has revisited the 2021 highs around $94 and failed to break out, creating a potential double top structure if support levels fail. |
Frequently Asked Questions about MRVL
What is the current sentiment for MRVL?
The short-term sentiment for MRVL is currently Bearish because Price has rejected off major resistance near all-time highs and closed below the 20-month SMA. The MACD displays a fresh bearish crossover with a negative histogram, and RSI is declining towards the midline, indicating momentum is shifting downward in the near term.. The long-term trend is classified as Bullish.
What are the key support levels for MRVL?
StockDips.AI has identified key support levels for MRVL at $66.00 and $37.50. These levels may represent potential accumulation zones where buying interest could emerge.
Is MRVL in a significant dip or a Value Dip right now?
MRVL has a Value Score of 65/100. It is not currently flagged as a significant dip in the Top Dips list. It is not listed as a Value Dip because the long-term sentiment or value-score threshold does not qualify.
View the full interactive analysis on StockDips.AI.