NBIS Weekly Technical Analysis
Nebius Group
technology company specializing in infrastructure for the artificial intelligence (AI) industry
NBIS Technical Analysis Summary
NBIS has experienced a classic parabolic blow-off top followed by a violent and deep correction, severely damaging short-to-medium-term momentum as evidenced by plunging MACD and RSI indicators. While the aggressive sell-off warrants extreme caution, long-term investors should note that the macro uptrend remains technically intact as long as price holds above the critical 50-week SMA support zone near 130-140.
Included In Lists
Related Tickers of Interest
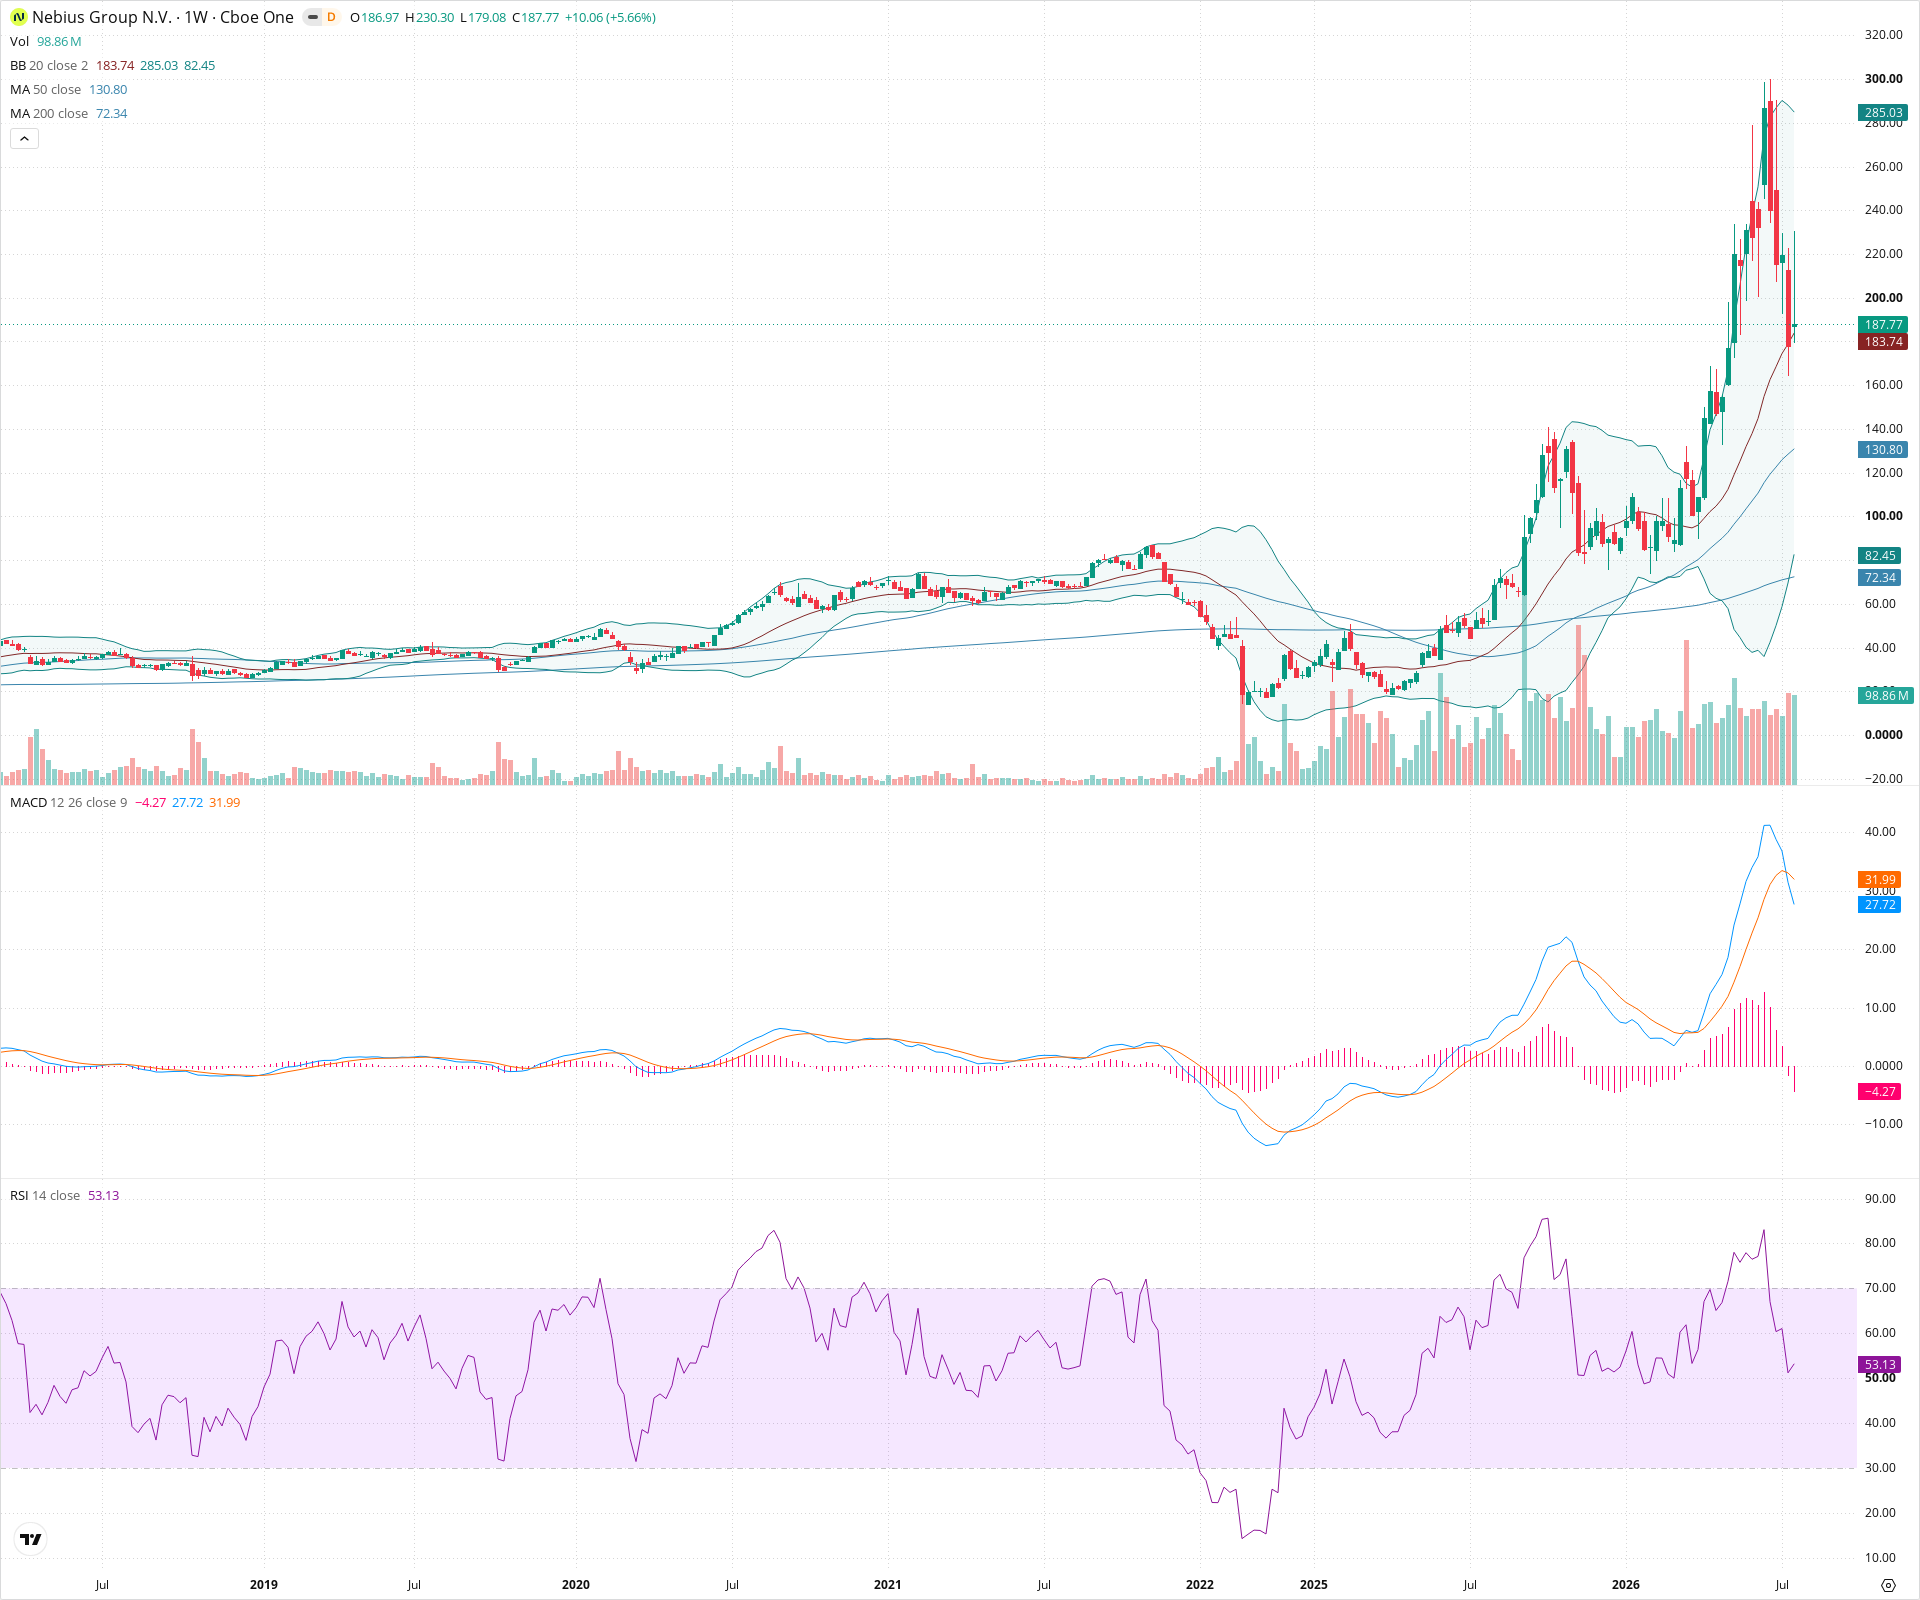
NBIS Weekly Chart
Sentiment
Short-term Sentiment (days to weeks): Bearish
The price has suffered a severe rejection from parabolic highs, breaking below the 20-week moving average. Momentum is strongly negative with the MACD line crossing well below the signal line and the histogram expanding downwards, while RSI is plunging rapidly from extreme overbought levels.
Long-term Sentiment (weeks to months): Bullish
Despite the brutal short-term correction, the macro structure remains in an uptrend. The price is still situated well above the rising 50-week SMA and the 200-week SMA, indicating that the long-term trend has not yet broken down.
Report Metadata
- Timeframe: weekly
- Generated at: 2026-07-25T09:08:14.319Z
- Model: gemini-3.1-pro-preview
Support Price Levels
| Level | Range | Strength | Notes |
|---|---|---|---|
| $165.00 | $160.00 - $170.00 | Weak | Minor consolidation zone formed during the aggressive run-up. |
| $135.00 | $130.00 - $140.00 | Strong | Crucial structural support zone aligning with previous swing highs before the final parabolic leg, and it converges with the currently rising 50-week SMA. |
| $95.00 | $90.00 - $100.00 | Strong | Major prior multi-year resistance area that should now act as strong foundational support if the correction deepens significantly. |
Resistance Price Levels
| Level | Range | Strength | Notes |
|---|---|---|---|
| $227.50 | $220.00 - $235.00 | Strong | Recent area of price consolidation that failed and broke down; will likely act as strong supply on any dead-cat bounce. |
| $300.00 | $280.00 - $320.00 | Strong | The massive blow-off top peak zone; represents massive overhead supply. |
Potential Chart Patterns in Formation
| Strength | Pattern | Signal | Target | Details |
|---|---|---|---|---|
| Strong | Parabolic Blow-off Top | Bearish | $135.00 | An unsustainable, vertical price ascent that culminated in a sharp, high-volume reversal, indicating exhaustion of buyers and a shift in momentum. |
Frequently Asked Questions about NBIS
What is the current sentiment for NBIS?
The short-term sentiment for NBIS is currently Bearish because The price has suffered a severe rejection from parabolic highs, breaking below the 20-week moving average. Momentum is strongly negative with the MACD line crossing well below the signal line and the histogram expanding downwards, while RSI is plunging rapidly from extreme overbought levels.. The long-term trend is classified as Bullish.
What are the key support levels for NBIS?
StockDips.AI has identified key support levels for NBIS at $165.00 and $135.00. These levels may represent potential accumulation zones where buying interest could emerge.
Is NBIS in a significant dip or a Value Dip right now?
NBIS has a Value Score of 52/100. It is not currently flagged as a significant dip in the Top Dips list. It is not listed as a Value Dip because the long-term sentiment or value-score threshold does not qualify.
View the full interactive analysis on StockDips.AI.