NBIS Monthly Technical Analysis
Nebius Group
technology company specializing in infrastructure for the artificial intelligence (AI) industry
NBIS Technical Analysis Summary
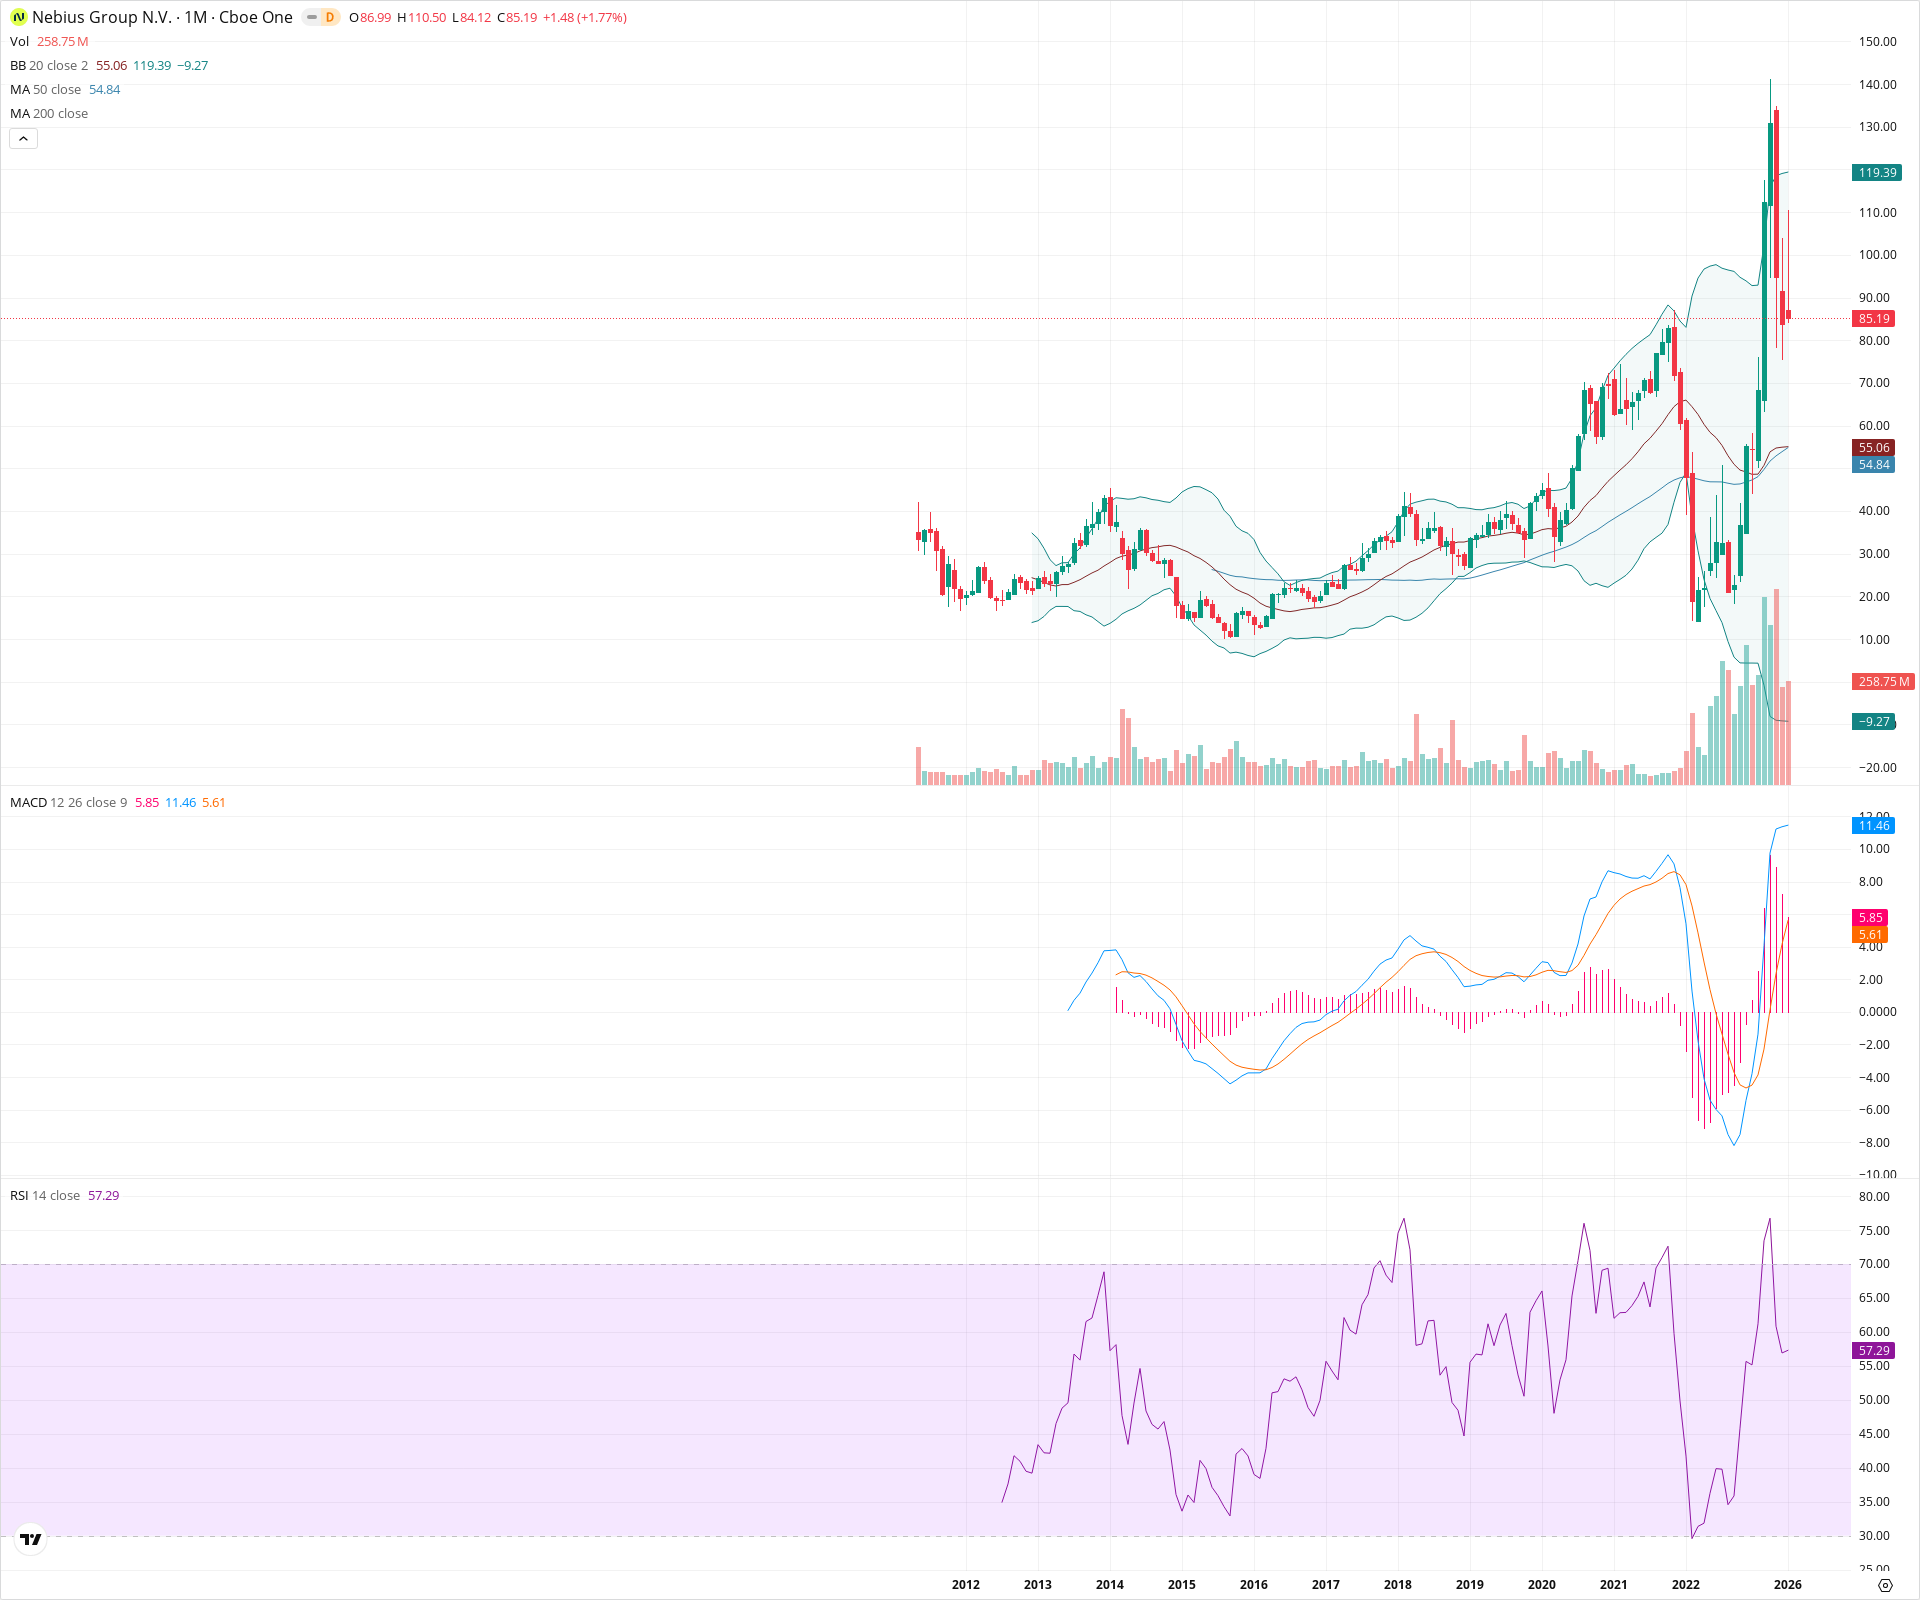
The chart shows a volatile but structurally bullish recovery, with a massive breakout from a multi-year base driving prices to new highs. However, the recent parabolic move to ~132 has triggered a severe correction, bringing price back to test the 2021 breakout level (~85) as support. While the long-term indicators like MACD and moving average alignment confirm a bull regime, the immediate outlook requires stabilization at this key support zone to prevent a deeper mean reversion toward the 50-month SMA.
Included In Lists
Related Tickers of Interest
NBIS Monthly Chart
Sentiment
Short-term Sentiment (days to weeks): Bearish
The stock is undergoing a sharp correction from recent highs of ~132, with consecutive large red monthly candles indicating strong profit-taking and momentum cooling.
Long-term Sentiment (weeks to months): Bullish
Despite the recent pullback, the stock remains in a secular uptrend, having broken out of a multi-year base. Price holds above key moving averages (20/50 SMA) and the 2021 highs, supported by a strongly positive MACD configuration.
Report Metadata
- Timeframe: monthly
- Generated at: 2026-02-02T06:46:37.387Z
- Model: gemini-3-pro-preview
Support Price Levels
| Level | Range | Strength | Notes |
|---|---|---|---|
| $83.50 | $80.00 - $87.00 | Strong | Previous major structural highs from 2021 acting as a polarity support zone (resistance turned support) currently being tested. |
| $55.00 | $54.00 - $56.00 | Strong | Confluence of the 20-month SMA and 50-month SMA, representing the dynamic mean reversion support level. |
| $32.50 | $30.00 - $35.00 | Weak | Original breakout zone from the long-term base structure. |
Resistance Price Levels
| Level | Range | Strength | Notes |
|---|---|---|---|
| $119.00 | $118.00 - $120.00 | Weak | Approximate location of the upper Bollinger Band and recent consolidation before the final drop. |
| $131.50 | $130.00 - $133.00 | Strong | Recent all-time high and peak of the parabolic move, marking the current ceiling. |
Potential Chart Patterns in Formation
| Strength | Pattern | Signal | Target | Details |
|---|---|---|---|---|
| Strong | Rounding Bottom / Saucer | Bullish | N/A | A multi-year base formation from 2022 to 2024 that resolved in a powerful breakout above the $30 range. |
| Strong | Parabolic Retracement | Bearish | $55.00 | After a vertical ascent to ~132, the price is rapidly mean-reverting, typical of blow-off top scenarios. |
Frequently Asked Questions about NBIS
What is the current sentiment for NBIS?
The short-term sentiment for NBIS is currently Bearish because The stock is undergoing a sharp correction from recent highs of ~132, with consecutive large red monthly candles indicating strong profit-taking and momentum cooling.. The long-term trend is classified as Bullish.
What are the key support levels for NBIS?
StockDips.AI has identified key support levels for NBIS at $83.50 and $55.00. These levels may represent potential accumulation zones where buying interest could emerge.
Is NBIS in a significant dip or a Value Dip right now?
NBIS has a Value Score of 52/100. It is not currently flagged as a significant dip in the Top Dips list. It is not listed as a Value Dip because the long-term sentiment or value-score threshold does not qualify.
View the full interactive analysis on StockDips.AI.