NKE Weekly Technical Analysis
Nike Inc
Designs and markets athletic footwear, apparel, and equipment worldwide.
NKE Technical Analysis Summary
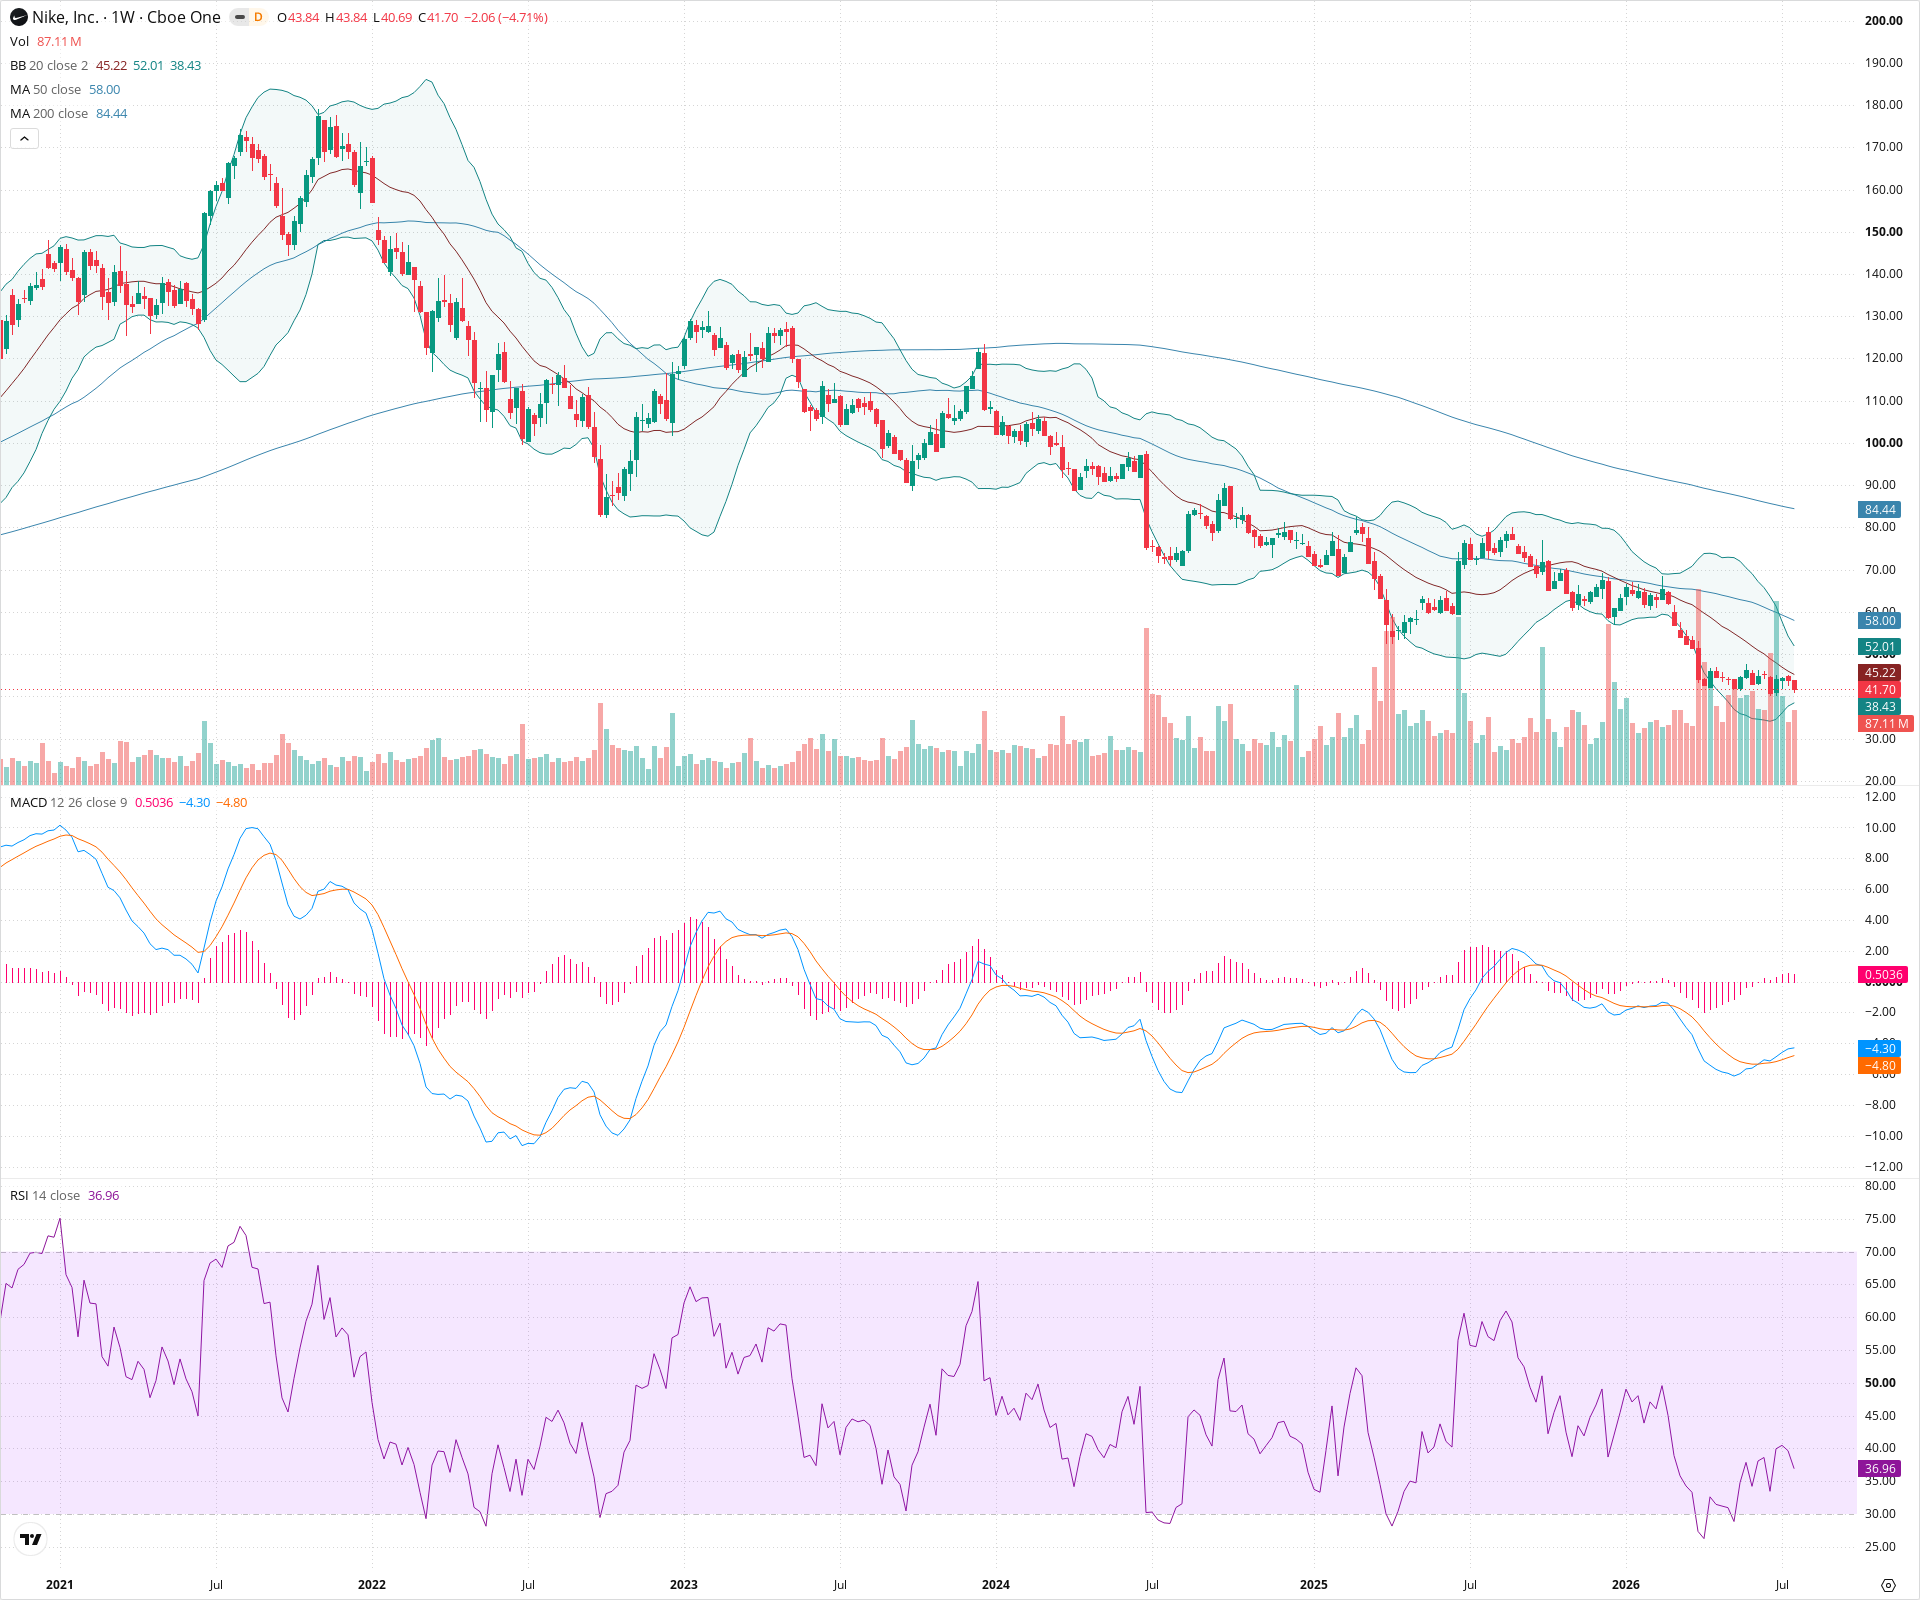
NKE is firmly entrenched in a severe, multi-year downtrend, highlighted by a recent and devastating breakdown on record volume. Significant technical damage has been inflicted, with price trading far below all key long-term moving averages. The deep oversold condition on RSI has only resulted in a weak, flat consolidation, suggesting that substantial overhead supply will likely cap any near-term rallies until a prolonged basing phase occurs.
Included In Lists
Related Tickers of Interest
NKE Weekly Chart
Sentiment
Short-term Sentiment (days to weeks): Bearish
Price recently suffered a massive, high-volume breakdown and is weakly consolidating near its lows, well below the declining 20-week SMA.
Long-term Sentiment (weeks to months): Bearish
The chart displays a severe multi-year downtrend, with the price trading far below both the 50-week and 200-week SMAs, which are in a bearish alignment and sloping downward.
Report Metadata
- Timeframe: weekly
- Generated at: 2026-07-25T09:06:21.498Z
- Model: gemini-3.1-pro-preview
Support Price Levels
| Level | Range | Strength | Notes |
|---|---|---|---|
| $39.00 | $38.00 - $40.00 | Strong | Recent structural lows established immediately following the massive gap down and selling climax. |
Resistance Price Levels
| Level | Range | Strength | Notes |
|---|---|---|---|
| $46.00 | $45.00 - $47.00 | Weak | Near-term resistance at the top of the current tight consolidation range and the 20-week SMA. |
| $71.50 | $68.00 - $75.00 | Strong | Major structural resistance zone marking the origin of the recent high-volume breakdown and previous consolidation support. |
Potential Chart Patterns in Formation
| Strength | Pattern | Signal | Target | Details |
|---|---|---|---|---|
| Strong | High-Volume Breakdown | Bearish | N/A | A catastrophic, single-week price collapse accompanied by a massive spike in selling volume, indicating a severe structural failure and overwhelming distribution. |
Frequently Asked Questions about NKE
What is the current sentiment for NKE?
The short-term sentiment for NKE is currently Bearish because Price recently suffered a massive, high-volume breakdown and is weakly consolidating near its lows, well below the declining 20-week SMA.. The long-term trend is classified as Bearish.
What are the key support levels for NKE?
StockDips.AI has identified key support levels for NKE at $39.00. These levels may represent potential accumulation zones where buying interest could emerge.
Is NKE in a significant dip or a Value Dip right now?
NKE has a Value Score of 72/100. It is currently flagged as a significant dip in the Top Dips list. It is not listed as a Value Dip because the long-term sentiment or value-score threshold does not qualify.
View the full interactive analysis on StockDips.AI.