NKE Monthly Technical Analysis
Nike Inc
Designs and markets athletic footwear, apparel, and equipment worldwide.
NKE Technical Analysis Summary
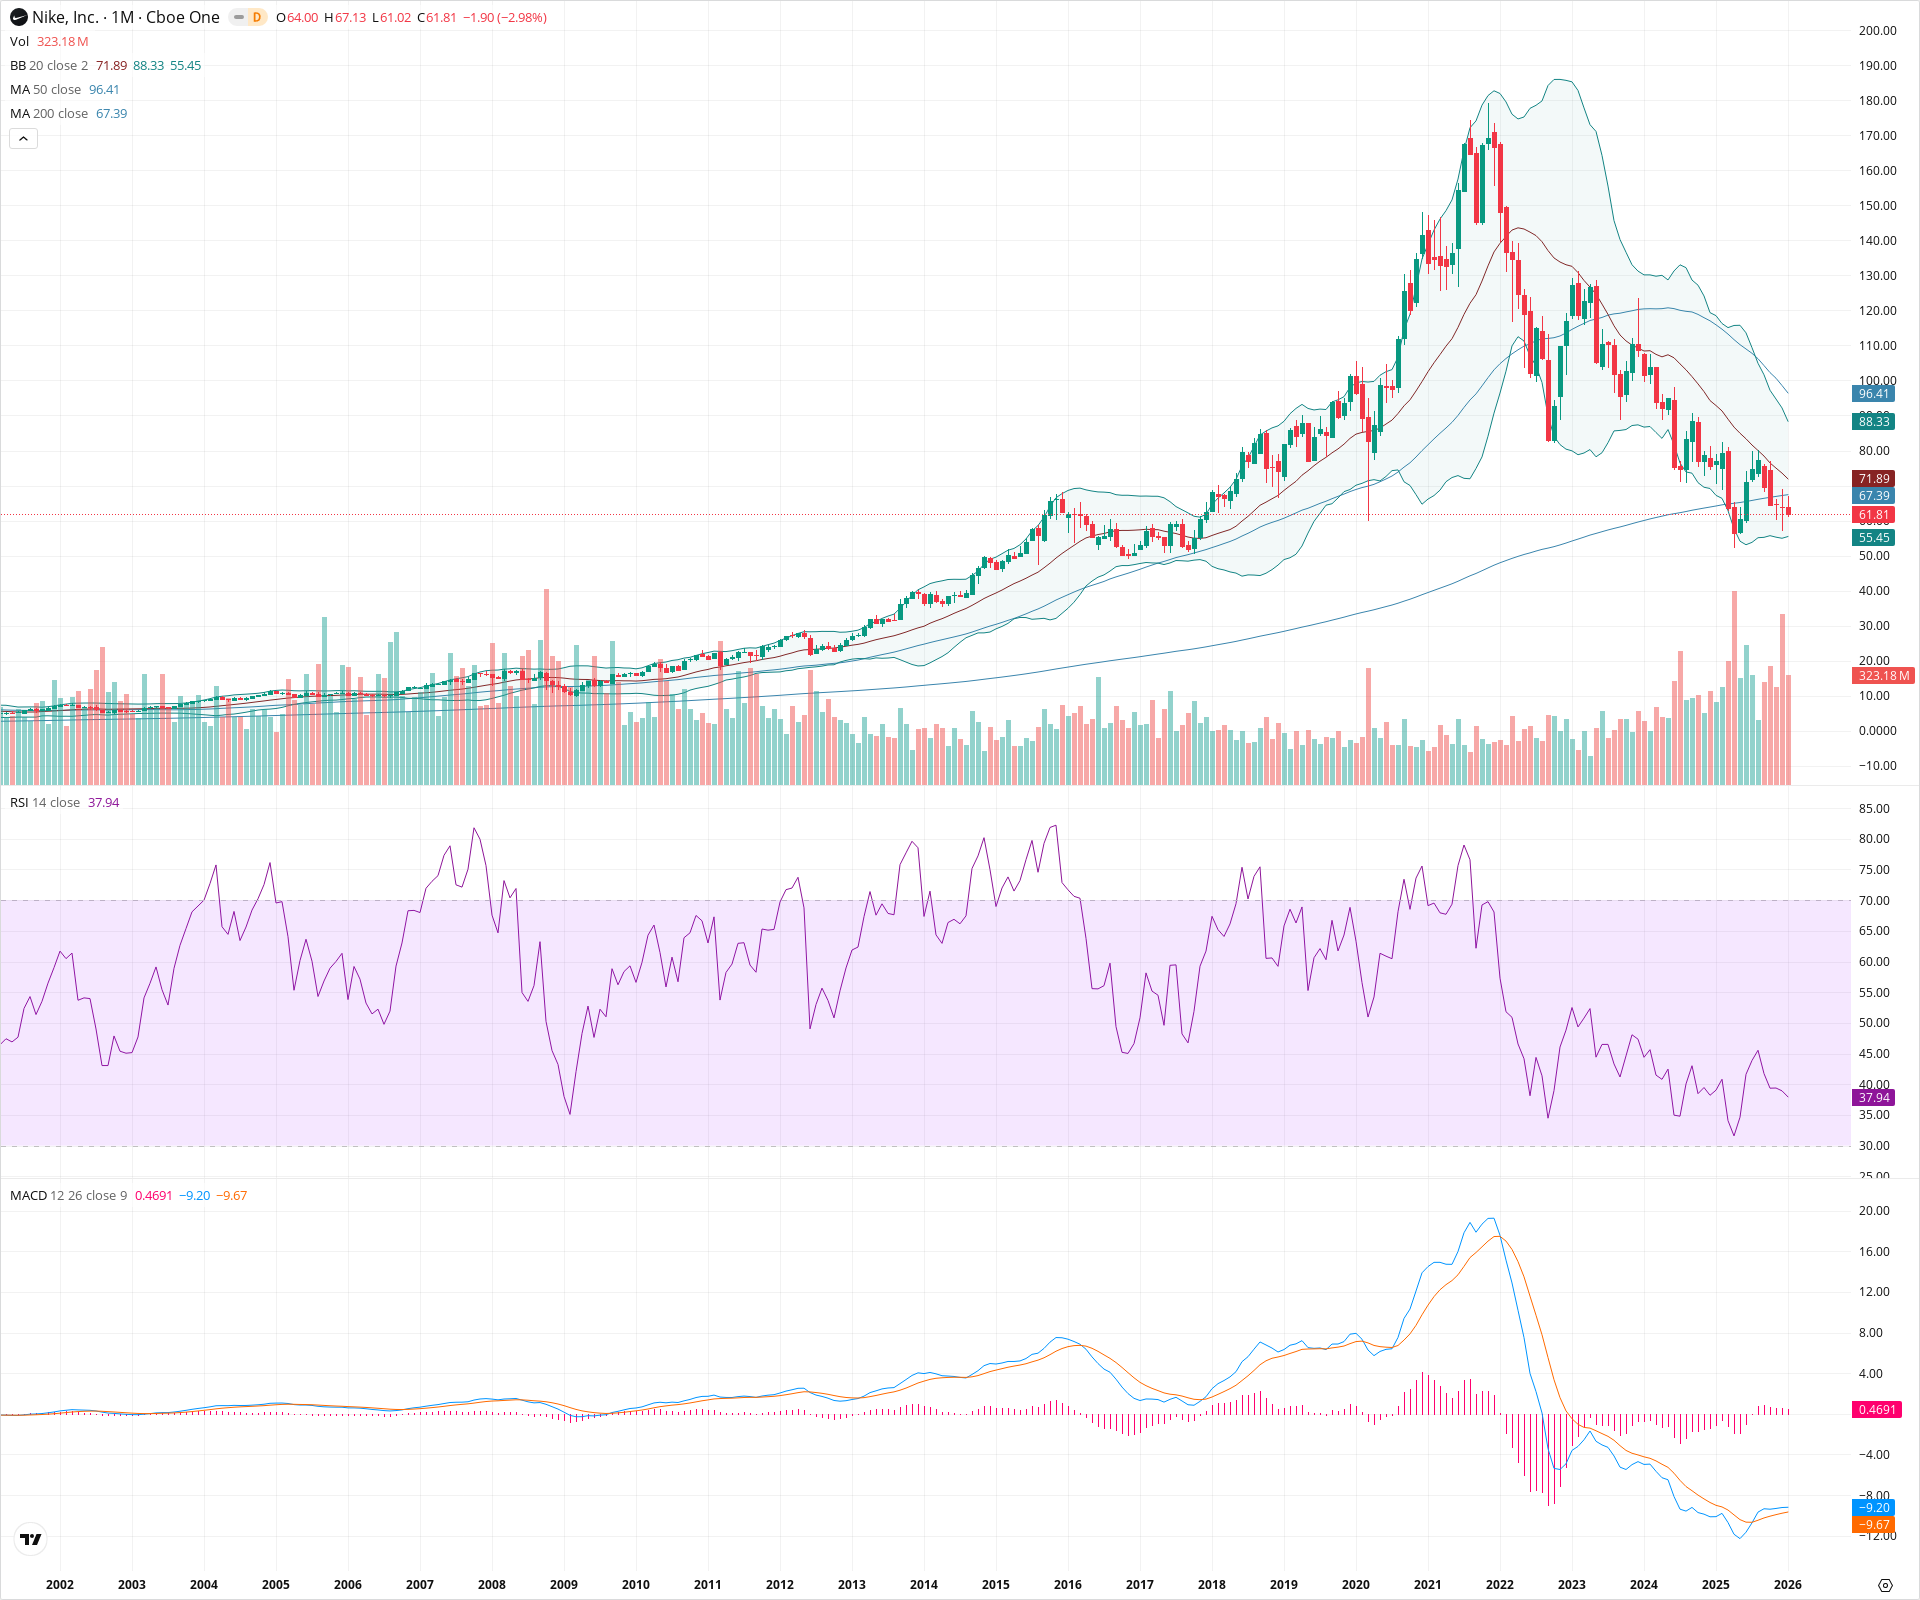
Nike is undergoing a significant secular correction, having broken the long-standing support of its 200-month SMA. The stock remains in a confirmed bear market with momentum indicators like the RSI holding in bearish territory below 40. While the MACD histogram suggests selling pressure may be decelerating slightly, the structural damage is severe, with the next major historical support zone lying between $50 and $55.
Included In Lists
Related Tickers of Interest
NKE Monthly Chart
Sentiment
Short-term Sentiment (days to weeks): Bearish
Price is currently trading below the 200-month SMA and remains in a strong downtrend channel. The RSI is below 40, indicating bearish momentum, although the MACD histogram shows slight deceleration.
Long-term Sentiment (weeks to months): Bearish
The stock has suffered a major structural breakdown, falling significantly from its 2021 highs and recently violating the critical 200-month SMA support level. The 50-month SMA is trending downward well above the current price, confirming a long-term regime change.
Report Metadata
- Timeframe: monthly
- Generated at: 2026-02-02T06:47:06.711Z
- Model: gemini-3-pro-preview
Support Price Levels
| Level | Range | Strength | Notes |
|---|---|---|---|
| $61.00 | $60.00 - $62.00 | Weak | Previous panic lows from early 2020 (COVID crash) which are currently being tested. |
| $52.50 | $50.00 - $55.00 | Strong | Historical consolidation zone and lows from the 2017-2018 period. |
Resistance Price Levels
| Level | Range | Strength | Notes |
|---|---|---|---|
| $67.50 | $67.00 - $68.00 | Strong | The 200-month SMA, which formerly acted as support, will now likely act as significant dynamic resistance. |
| $87.50 | $85.00 - $90.00 | Strong | Zone of previous consolidation before the recent leg down, coinciding near the 20-period Bollinger Band midline. |
| $98.00 | $96.00 - $100.00 | Strong | Confluence of the 50-month SMA and the psychological $100 level. |
Potential Chart Patterns in Formation
| Strength | Pattern | Signal | Target | Details |
|---|---|---|---|---|
| Strong | Secular Breakdown | Bearish | $50.00 | Price has decisively broken below the 200-month Moving Average after a multi-year downtrend from 2021 highs. |
| Strong | Descending Channel | Bearish | N/A | A persistent series of lower highs and lower lows established since the peak in late 2021. |
Frequently Asked Questions about NKE
What is the current sentiment for NKE?
The short-term sentiment for NKE is currently Bearish because Price is currently trading below the 200-month SMA and remains in a strong downtrend channel. The RSI is below 40, indicating bearish momentum, although the MACD histogram shows slight deceleration.. The long-term trend is classified as Bearish.
What are the key support levels for NKE?
StockDips.AI has identified key support levels for NKE at $61.00 and $52.50. These levels may represent potential accumulation zones where buying interest could emerge.
Is NKE in a significant dip or a Value Dip right now?
NKE has a Value Score of 72/100. It is currently flagged as a significant dip in the Top Dips list. It is not listed as a Value Dip because the long-term sentiment or value-score threshold does not qualify.
View the full interactive analysis on StockDips.AI.