ORCL Monthly Technical Analysis
Oracle Corporation
A global enterprise software and cloud infrastructure provider offering databases, ERP systems, and cloud services. Known for its mission-critical business software and rapidly growing Oracle Cloud Infrastructure (OCI).
ORCL Technical Analysis Summary
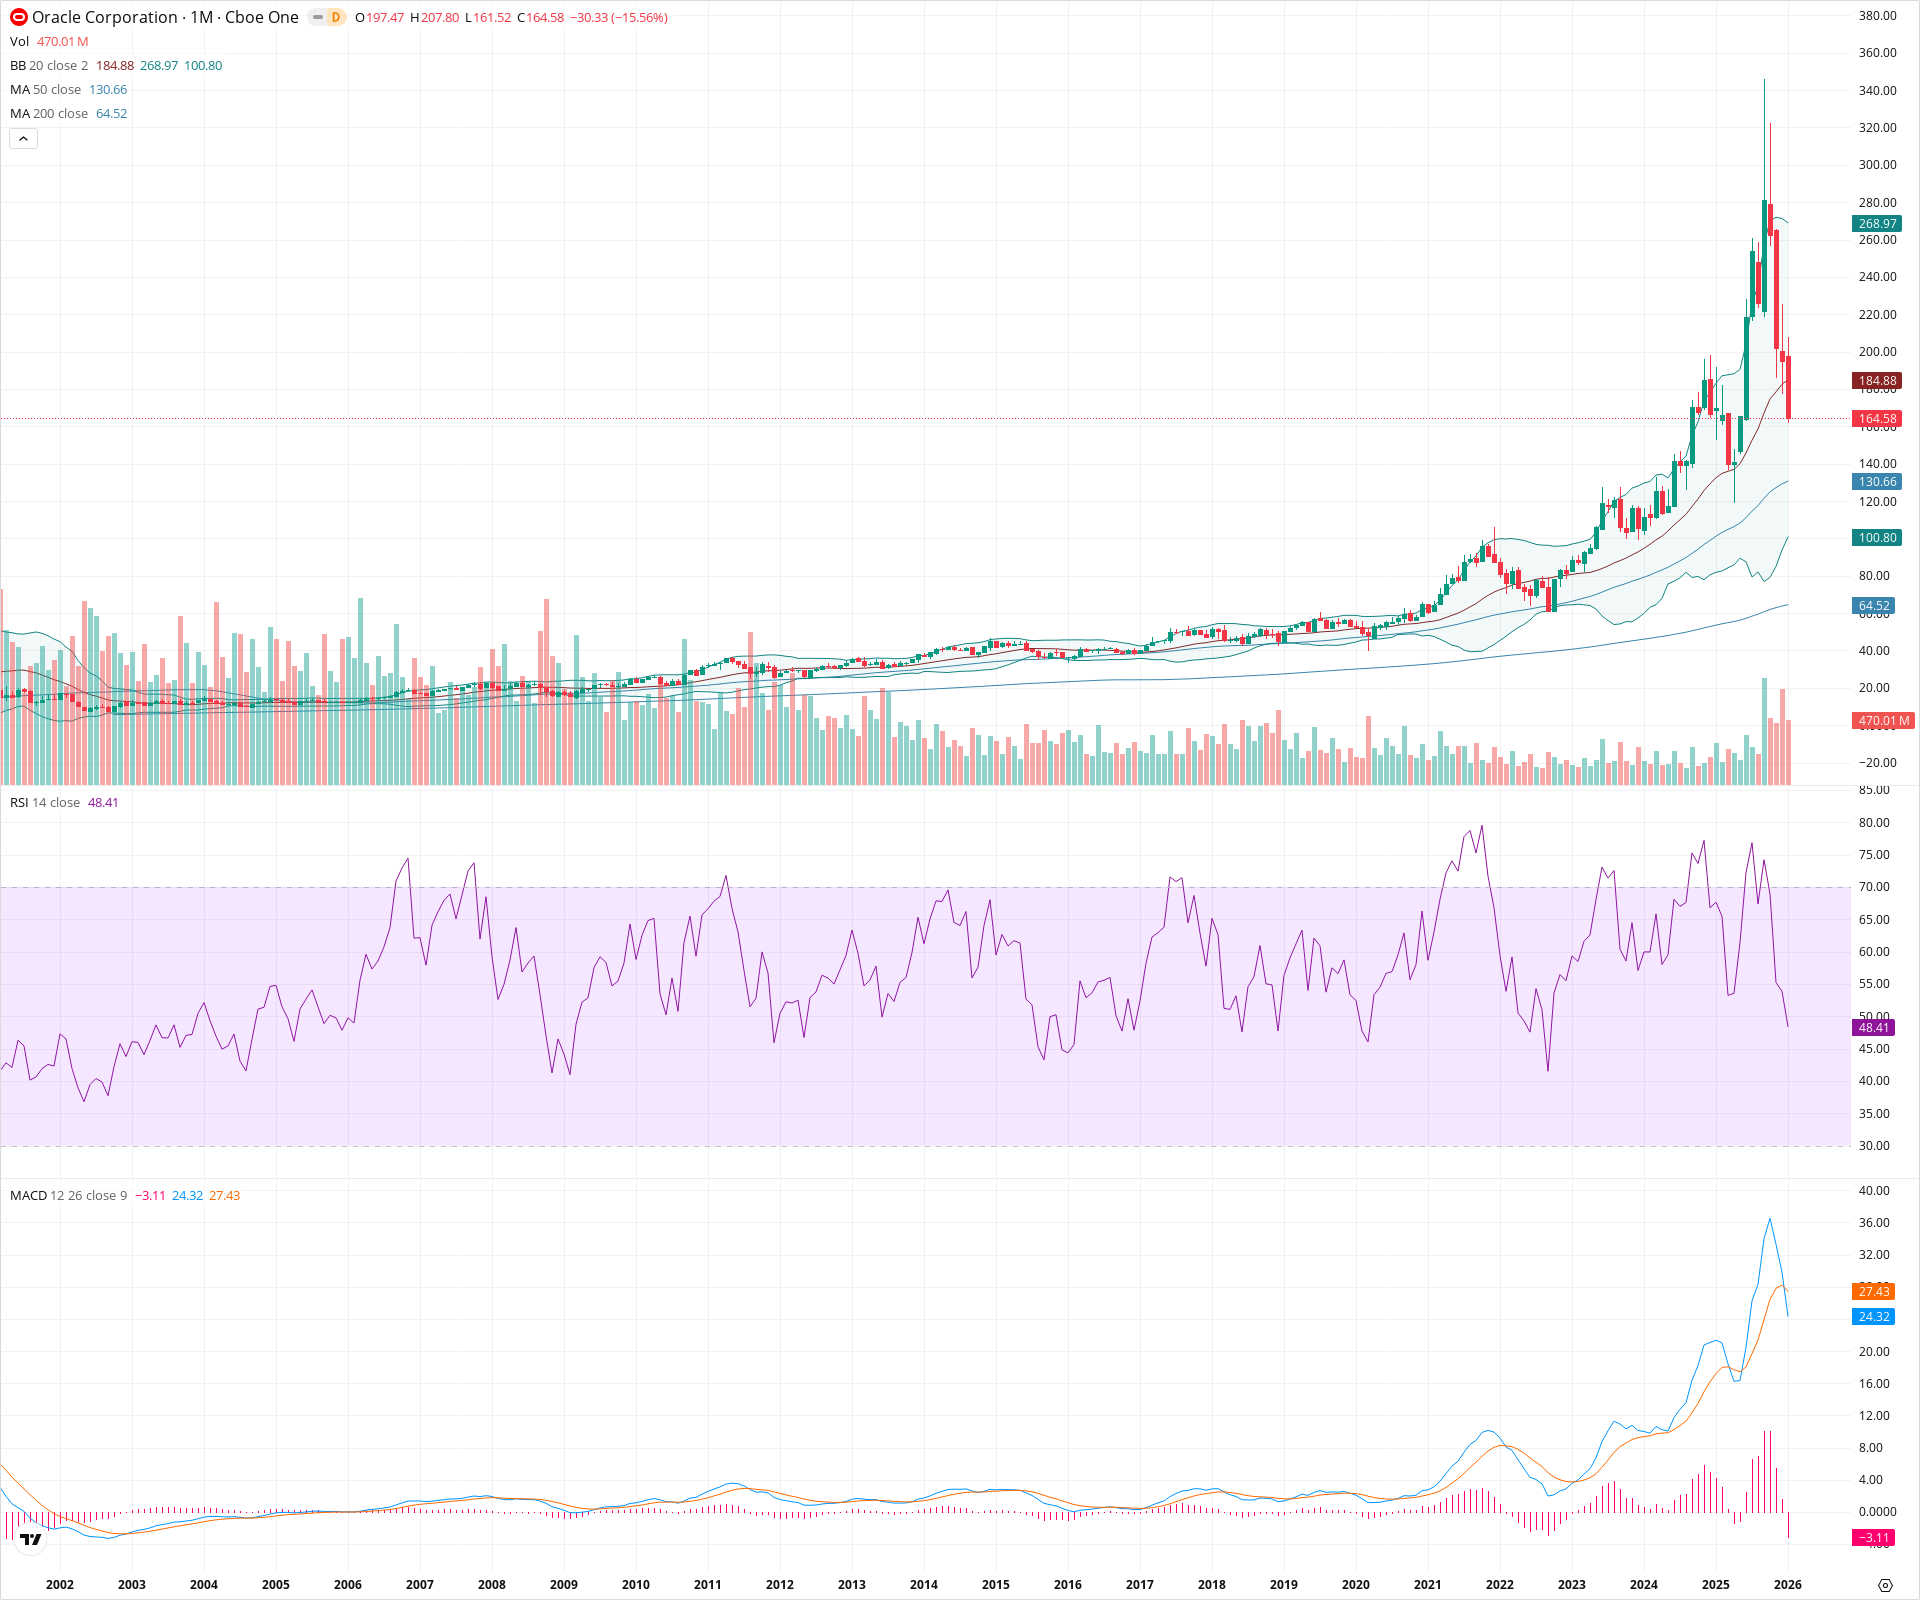
Oracle is undergoing a significant corrective phase after a parabolic run to all-time highs, evidenced by a bearish MACD crossover and a close below the 20-month SMA. While the short-term momentum is decisively negative, likely seeking support near the 50-month SMA around 130, the long-term structural trend remains bullish with price levels well above major secular moving averages.
Included In Lists
Related Tickers of Interest
ORCL Monthly Chart
Sentiment
Short-term Sentiment (days to weeks): Bearish
Price has broken below the 20-month SMA (184.88) with a large bearish candle dropping over 15%. A fresh bearish crossover on the MACD confirms downward momentum, and the RSI has fallen sharply from overbought territory.
Long-term Sentiment (weeks to months): Bullish
The stock remains in a well-defined secular uptrend, positioned significantly above the rising 50-month (130.66) and 200-month (64.52) SMAs. The current pullback is technically a reversion to the mean within a broader bull market.
Report Metadata
- Timeframe: monthly
- Generated at: 2026-02-02T06:56:04.951Z
- Model: gemini-3-pro-preview
Support Price Levels
| Level | Range | Strength | Notes |
|---|---|---|---|
| $127.83 | $125.00 - $130.66 | Strong | Confluence of the 50-month SMA and a consolidation zone formed during late 2023/early 2024. |
| $102.50 | $100.00 - $105.00 | Strong | Major psychological level, lower Bollinger Band proximity, and the site of the multi-year breakout from 2021 highs. |
Resistance Price Levels
| Level | Range | Strength | Notes |
|---|---|---|---|
| $184.50 | $184.00 - $185.00 | Weak | The 20-month SMA (Bollinger Band basis) was formerly support and now acts as immediate resistance following the breakdown. |
| $207.40 | $207.00 - $207.80 | Strong | All-time high and the peak of the current trend. |
Potential Chart Patterns in Formation
| Strength | Pattern | Signal | Target | Details |
|---|---|---|---|---|
| Strong | Parabolic Climax / Blow-off Top | Bearish | $130.66 | After a near-vertical ascent throughout 2024/2025, the price formed a sharp peak and reversed violently, indicating trend exhaustion and a shift to a corrective phase. |
Frequently Asked Questions about ORCL
What is the current sentiment for ORCL?
The short-term sentiment for ORCL is currently Bearish because Price has broken below the 20-month SMA (184.88) with a large bearish candle dropping over 15%. A fresh bearish crossover on the MACD confirms downward momentum, and the RSI has fallen sharply from overbought territory.. The long-term trend is classified as Bullish.
What are the key support levels for ORCL?
StockDips.AI has identified key support levels for ORCL at $127.83 and $102.50. These levels may represent potential accumulation zones where buying interest could emerge.
Is ORCL in a significant dip or a Value Dip right now?
ORCL has a Value Score of 73/100. It is currently flagged as a significant dip in the Top Dips list. It is also listed as a Value Dip because long-term sentiment is bullish.
View the full interactive analysis on StockDips.AI.