AAPL Daily Technical Analysis
Apple Inc
Designs consumer electronics like iPhone, iPad, and Mac, plus services such as iCloud and Apple Music.
AAPL Technical Analysis Summary
AAPL is exhibiting a robust, established long-term uptrend, trading comfortably above key moving averages. The recent breakout from a consolidation period highlights strong short-term momentum, supported by bullish MACD and RSI readings. While the stock may face minor resistance near recent highs or due to nearing overbought conditions, the overall technical posture remains highly favorable for trend continuation.
Included In Lists
Related Tickers of Interest
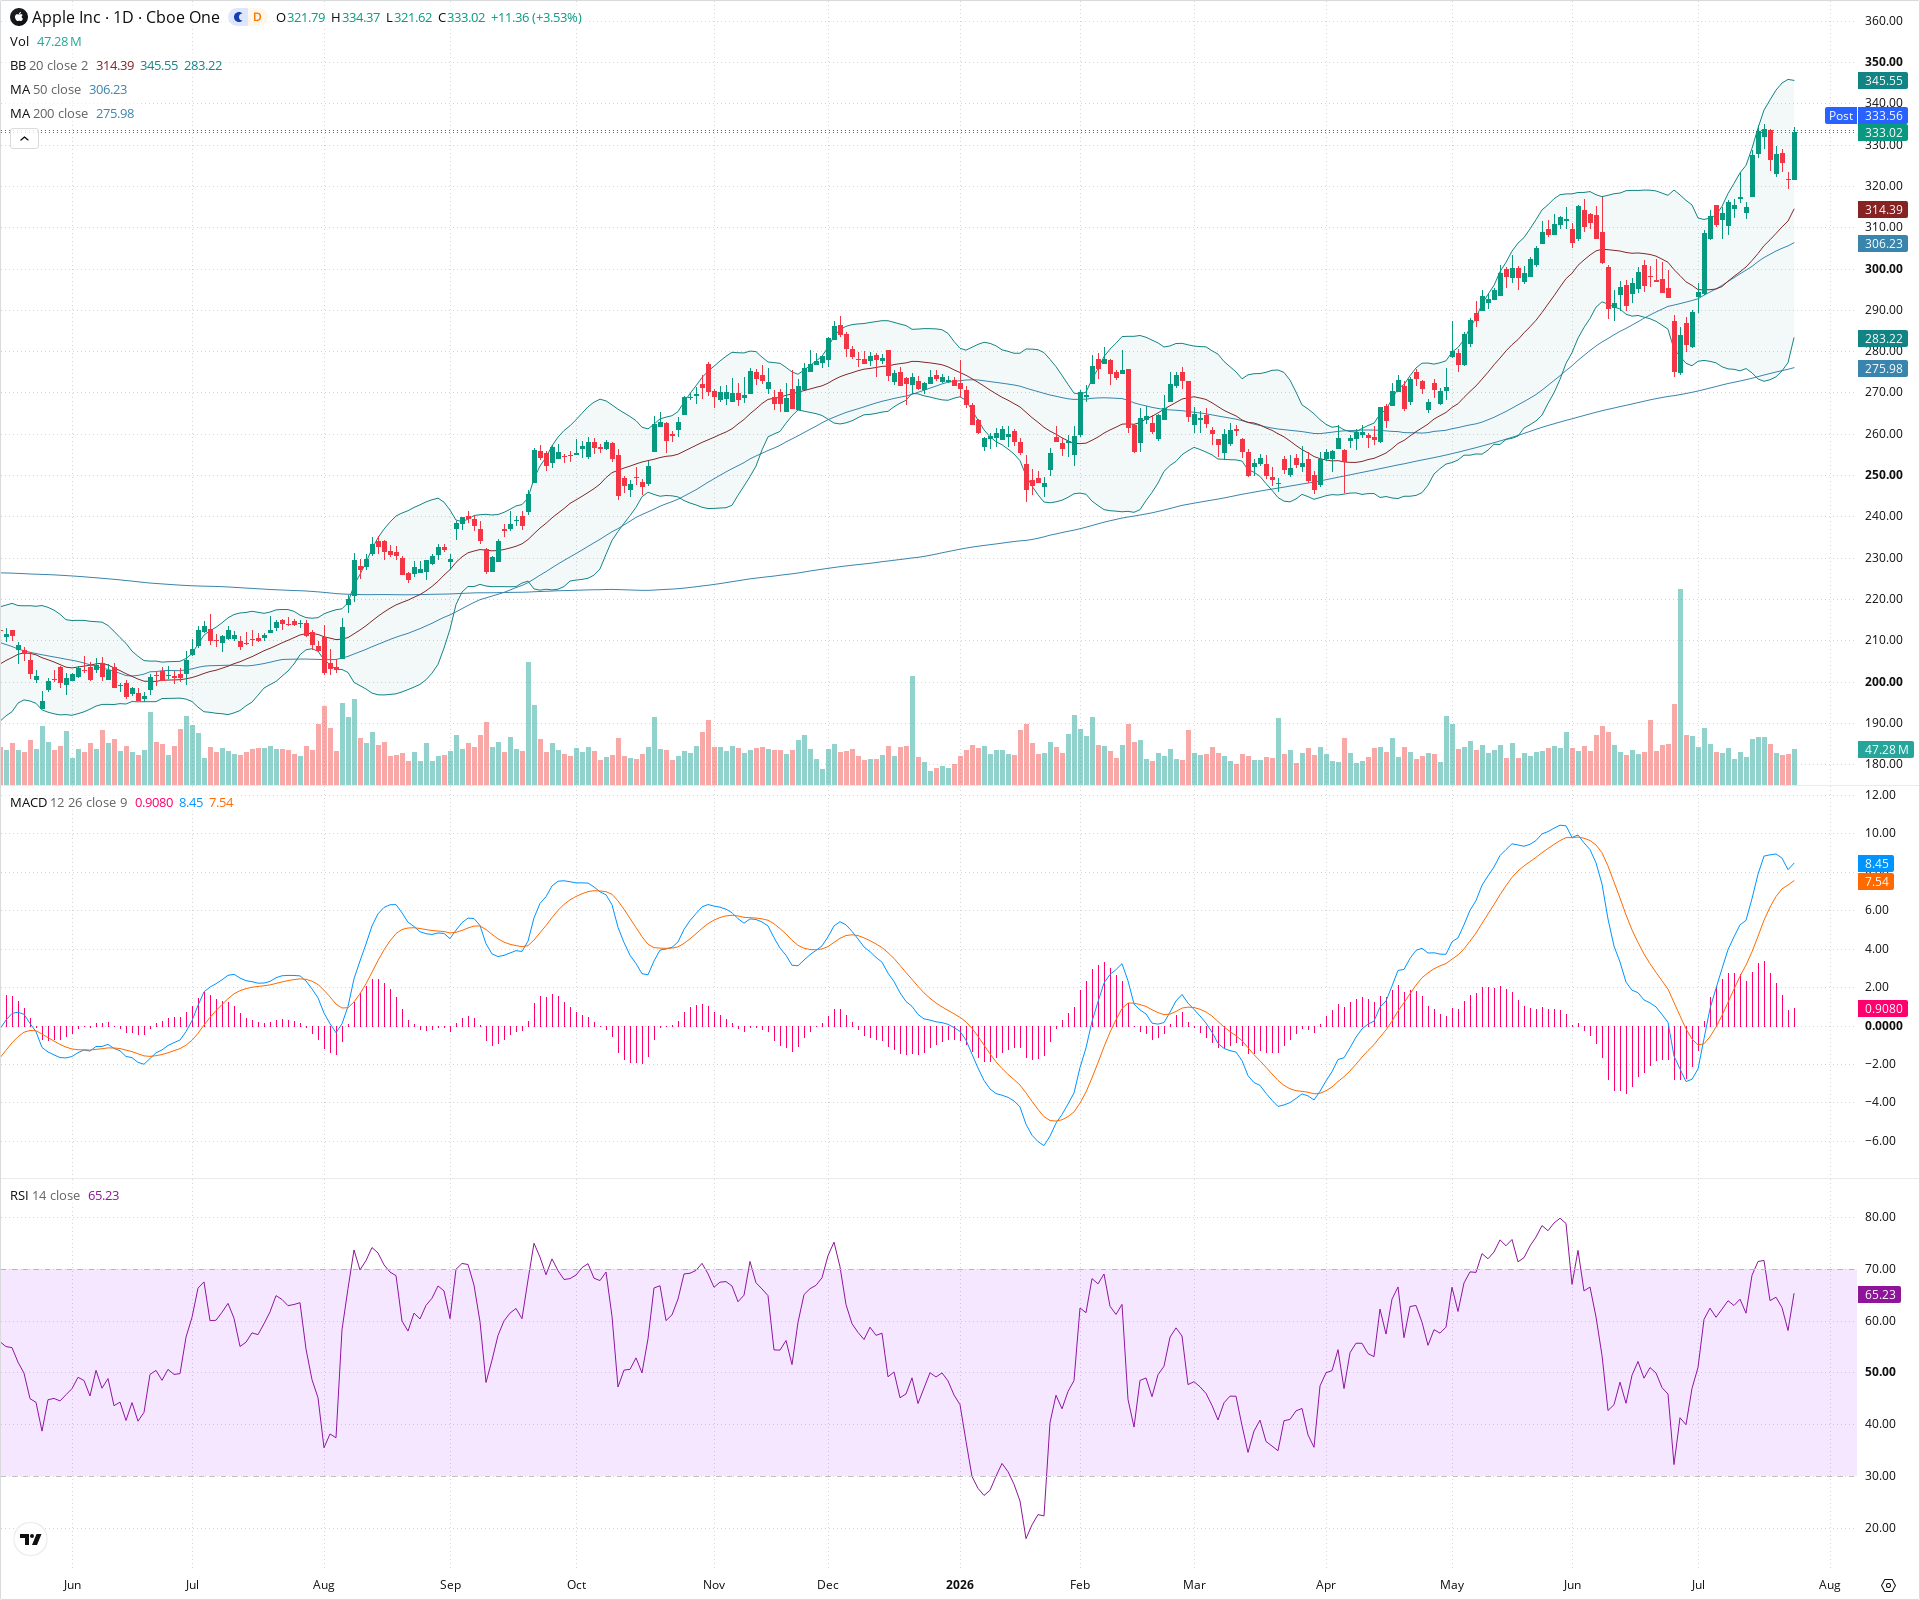
AAPL Daily Chart
Sentiment
Short-term Sentiment (days to weeks): Bullish
Price has broken out of recent consolidation to the upside and is currently riding the upper Bollinger Band. Bullish momentum is confirmed by a positive MACD crossover, an expanding histogram, and a rising RSI approaching 70.
Long-term Sentiment (weeks to months): Bullish
The chart displays a strong, sustained uptrend with the price consistently making higher highs and higher lows, remaining well above the positively sloping 50-day and 200-day simple moving averages.
Report Metadata
- Timeframe: daily
- Generated at: 2026-07-24T21:01:45.498Z
- Model: gemini-3.1-pro-preview
Support Price Levels
| Level | Range | Strength | Notes |
|---|---|---|---|
| $317.00 | $314.00 - $320.00 | Strong | Previous resistance zone that was recently broken, now expected to act as support. This area also aligns with the current position of the 20-day SMA. |
| $303.00 | $300.00 - $306.00 | Strong | Structural support from prior swing lows and consolidation area, currently reinforced by the rising 50-day SMA. |
| $277.50 | $275.00 - $280.00 | Strong | Major long-term support defined by deep swing lows and the upward trending 200-day SMA. |
Resistance Price Levels
| Level | Range | Strength | Notes |
|---|---|---|---|
| $337.00 | $334.00 - $340.00 | Weak | Immediate resistance near the recent swing high and psychological round numbers. The upper Bollinger Band also provides dynamic resistance in this zone. |
Potential Chart Patterns in Formation
| Strength | Pattern | Signal | Target | Details |
|---|---|---|---|---|
| Strong | Bullish Breakout | Bullish | N/A | Price decisively cleared a multi-week consolidation resistance level around 320, initiating a new impulsive wave upward. |
Frequently Asked Questions about AAPL
What is the current sentiment for AAPL?
The short-term sentiment for AAPL is currently Bullish because Price has broken out of recent consolidation to the upside and is currently riding the upper Bollinger Band. Bullish momentum is confirmed by a positive MACD crossover, an expanding histogram, and a rising RSI approaching 70.. The long-term trend is classified as Bullish.
What are the key support levels for AAPL?
StockDips.AI has identified key support levels for AAPL at $317.00 and $303.00. These levels may represent potential accumulation zones where buying interest could emerge.
Is AAPL in a significant dip or a Value Dip right now?
AAPL has a Value Score of 20/100. It is not currently flagged as a significant dip in the Top Dips list. It is not listed as a Value Dip because the long-term sentiment or value-score threshold does not qualify.
View the full interactive analysis on StockDips.AI.