META Daily Technical Analysis
Meta Platforms Inc
Owner of Facebook, Instagram, and WhatsApp with investment in AI and virtual reality.
META Technical Analysis Summary
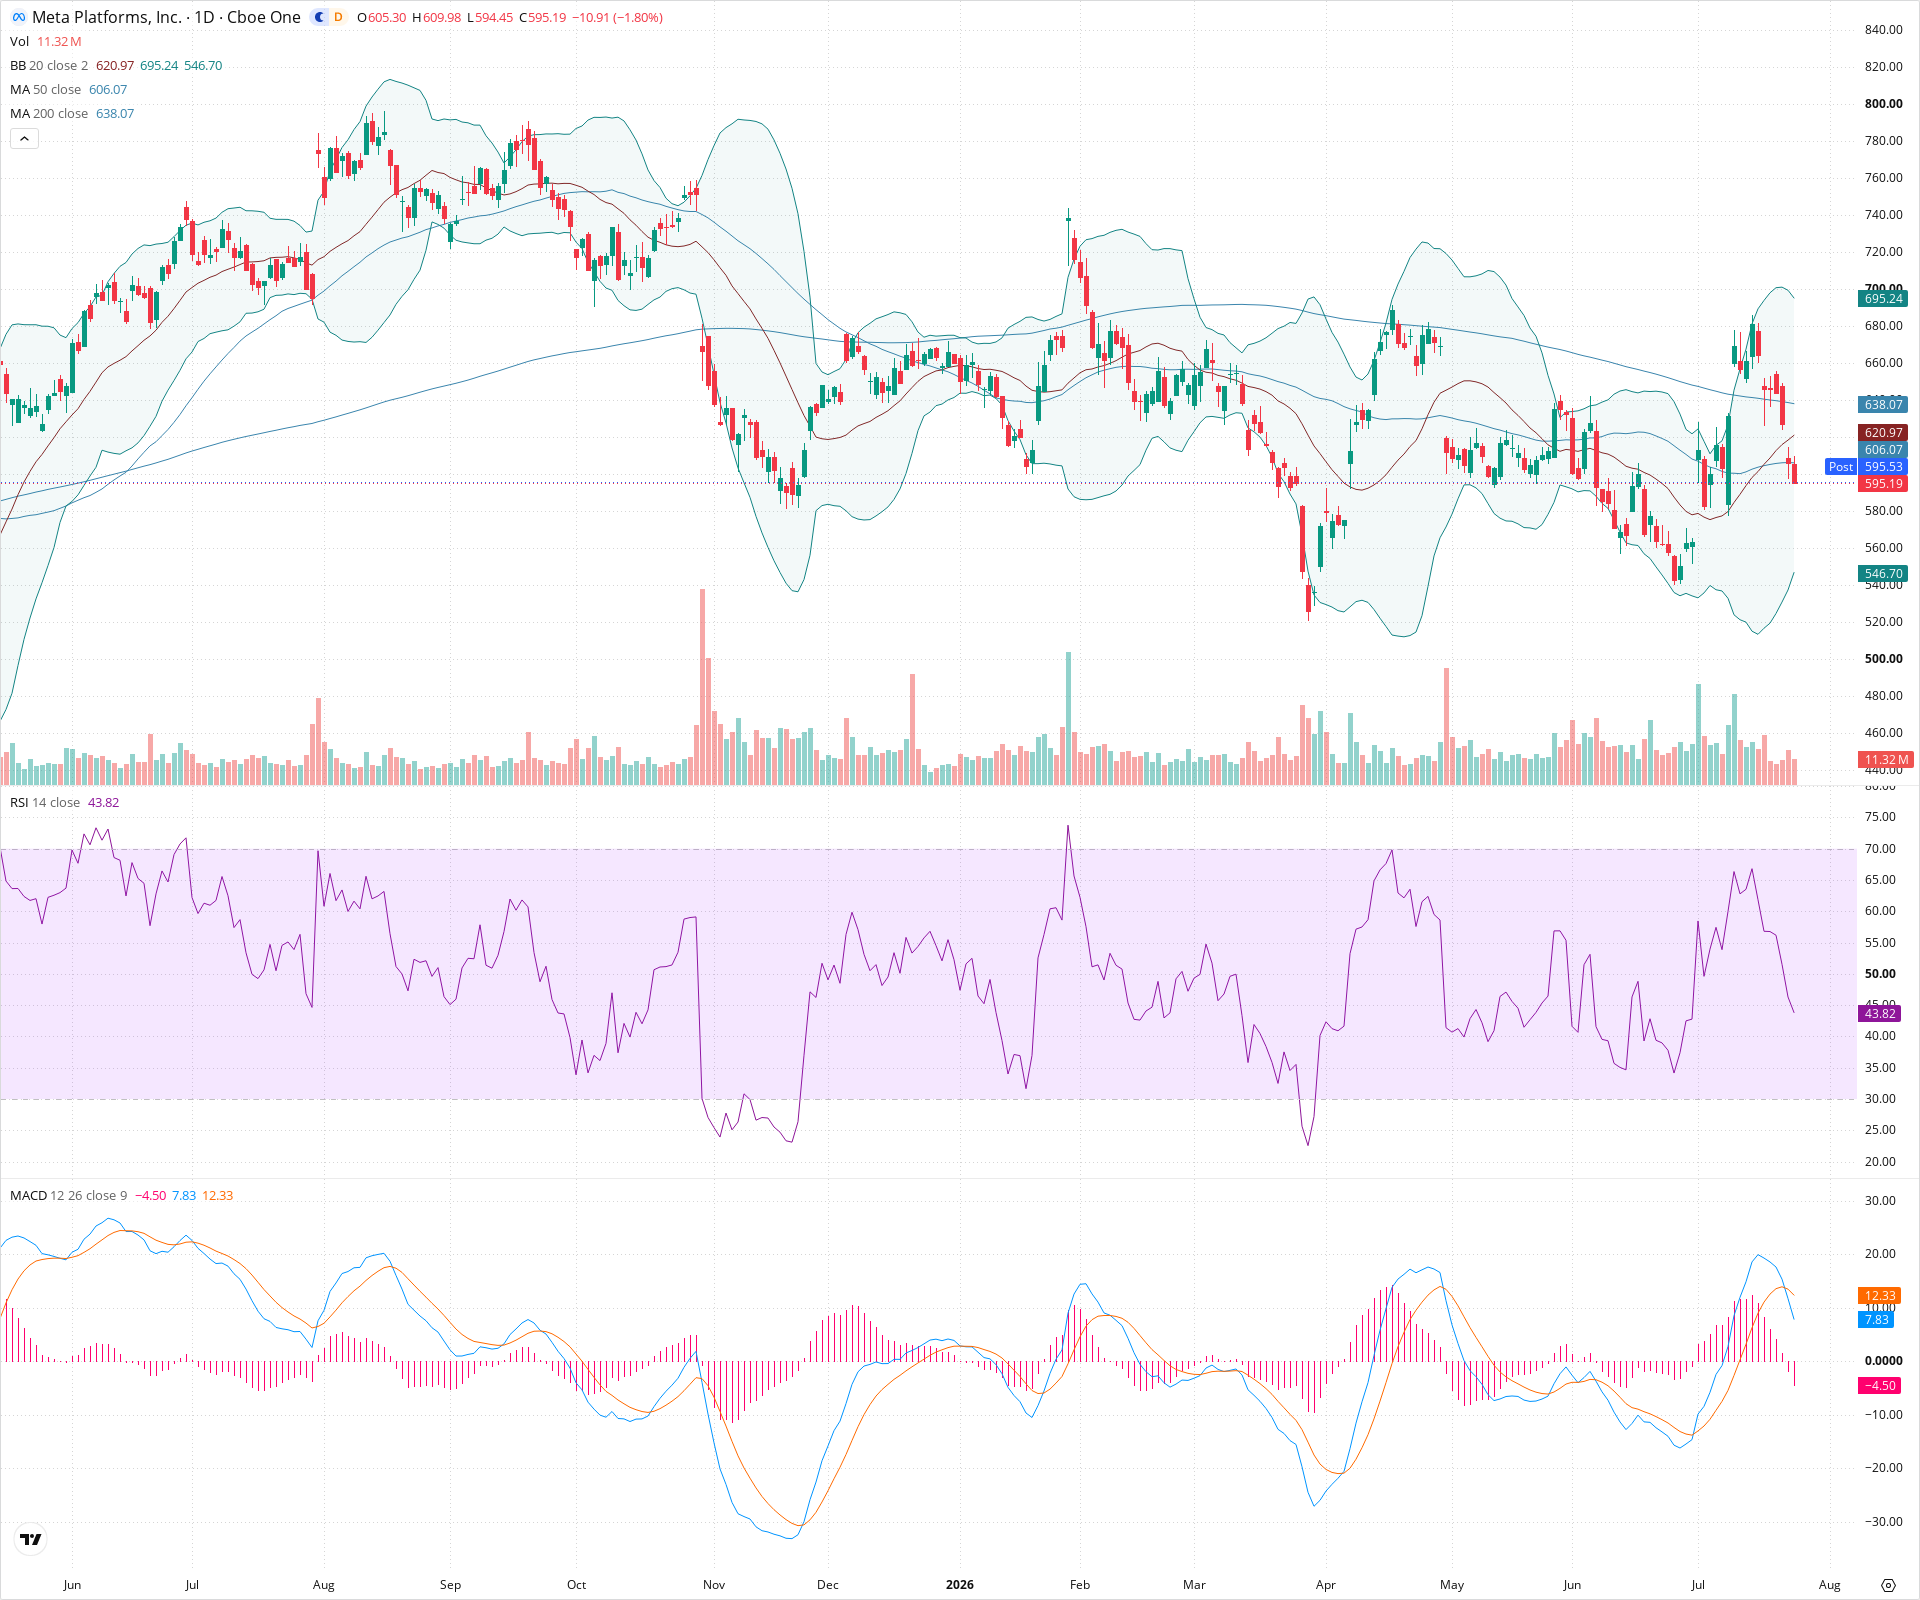
META is currently exhibiting a neutral long-term stance as it navigates a wide, multi-month consolidation range between roughly 540 and 700, characterized by a flat 200-day SMA. In the short term, the technical picture has deteriorated significantly following a failed test of range highs. The subsequent rejection has pushed the price below key near-term moving averages, with deteriorating momentum indicated by declining RSI and a bearish MACD crossover, suggesting further testing of lower support levels is likely.
Included In Lists
Related Tickers of Interest
META Daily Chart
Sentiment
Short-term Sentiment (days to weeks): Bearish
Price has recently suffered a sharp rejection from resistance near 700, breaking below both the 20-day and 50-day SMAs. This downward move is confirmed by a bearish MACD crossover with a widening negative histogram and an RSI declining towards the lower half of its range.
Long-term Sentiment (weeks to months): Neutral
The stock is trading in a wide, prolonged consolidation range roughly between 540 and 700. The 200-day SMA is relatively flat, and the price is currently oscillating around it, indicating a lack of a clear, sustained long-term trend in either direction.
Report Metadata
- Timeframe: daily
- Generated at: 2026-07-24T21:02:56.298Z
- Model: gemini-3.1-pro-preview
Support Price Levels
| Level | Range | Strength | Notes |
|---|---|---|---|
| $550.00 | $540.00 - $560.00 | Strong | A major swing low zone that provided significant support and led to strong bounces in April and late June. |
| $517.50 | $510.00 - $525.00 | Weak | Deeper historical support area established by swing lows late in the previous year. |
Resistance Price Levels
| Level | Range | Strength | Notes |
|---|---|---|---|
| $615.00 | $605.00 - $625.00 | Moderate | Immediate overhead resistance zone comprising the 50-day SMA (~606) and the 20-day SMA (~620). |
| $690.00 | $680.00 - $700.00 | Strong | The top of the multi-month trading range, where price has repeatedly failed, including the most recent peak. |
Potential Chart Patterns in Formation
| Strength | Pattern | Signal | Target | Details |
|---|---|---|---|---|
| Strong | Sideways Channel / Trading Range | Neutral | N/A | Price is contained within a broad consolidation structure defined by resistance near 700 and support around 540-560. |
| Moderate | Failed Breakout | Bearish | N/A | The recent attempt to push towards the top of the range (~700) was quickly rejected, resulting in a sharp bearish reversal and a breakdown below short-term moving averages. |
Frequently Asked Questions about META
What is the current sentiment for META?
The short-term sentiment for META is currently Bearish because Price has recently suffered a sharp rejection from resistance near 700, breaking below both the 20-day and 50-day SMAs. This downward move is confirmed by a bearish MACD crossover with a widening negative histogram and an RSI declining towards the lower half of its range.. The long-term trend is classified as Neutral.
What are the key support levels for META?
StockDips.AI has identified key support levels for META at $550.00 and $517.50. These levels may represent potential accumulation zones where buying interest could emerge.
Is META in a significant dip or a Value Dip right now?
META has a Value Score of 30/100. It is not currently flagged as a significant dip in the Top Dips list. It is not listed as a Value Dip because the long-term sentiment or value-score threshold does not qualify.
View the full interactive analysis on StockDips.AI.