PEP Monthly Technical Analysis
PepsiCo
Global food & beverage giant (Pepsi, Gatorade, Lays, Doritos)
PEP Technical Analysis Summary
PEP is currently executing a significant relief rally, bouncing sharply from the 136.01 level to reclaim the 20-month SMA, supported by a bullish MACD crossover below the zero line. The secular uptrend remains valid as long as price holds above the 200-month SMA, but the stock must overcome the 50-month SMA near 165 to confirm a resumption of the long-term bull market. Failure to breach this resistance could result in continued consolidation within the 136–165 range. The RSI recovery to 50 indicates momentum has neutralized, ending the immediate bearish pressure.
Included In Lists
Related Tickers of Interest
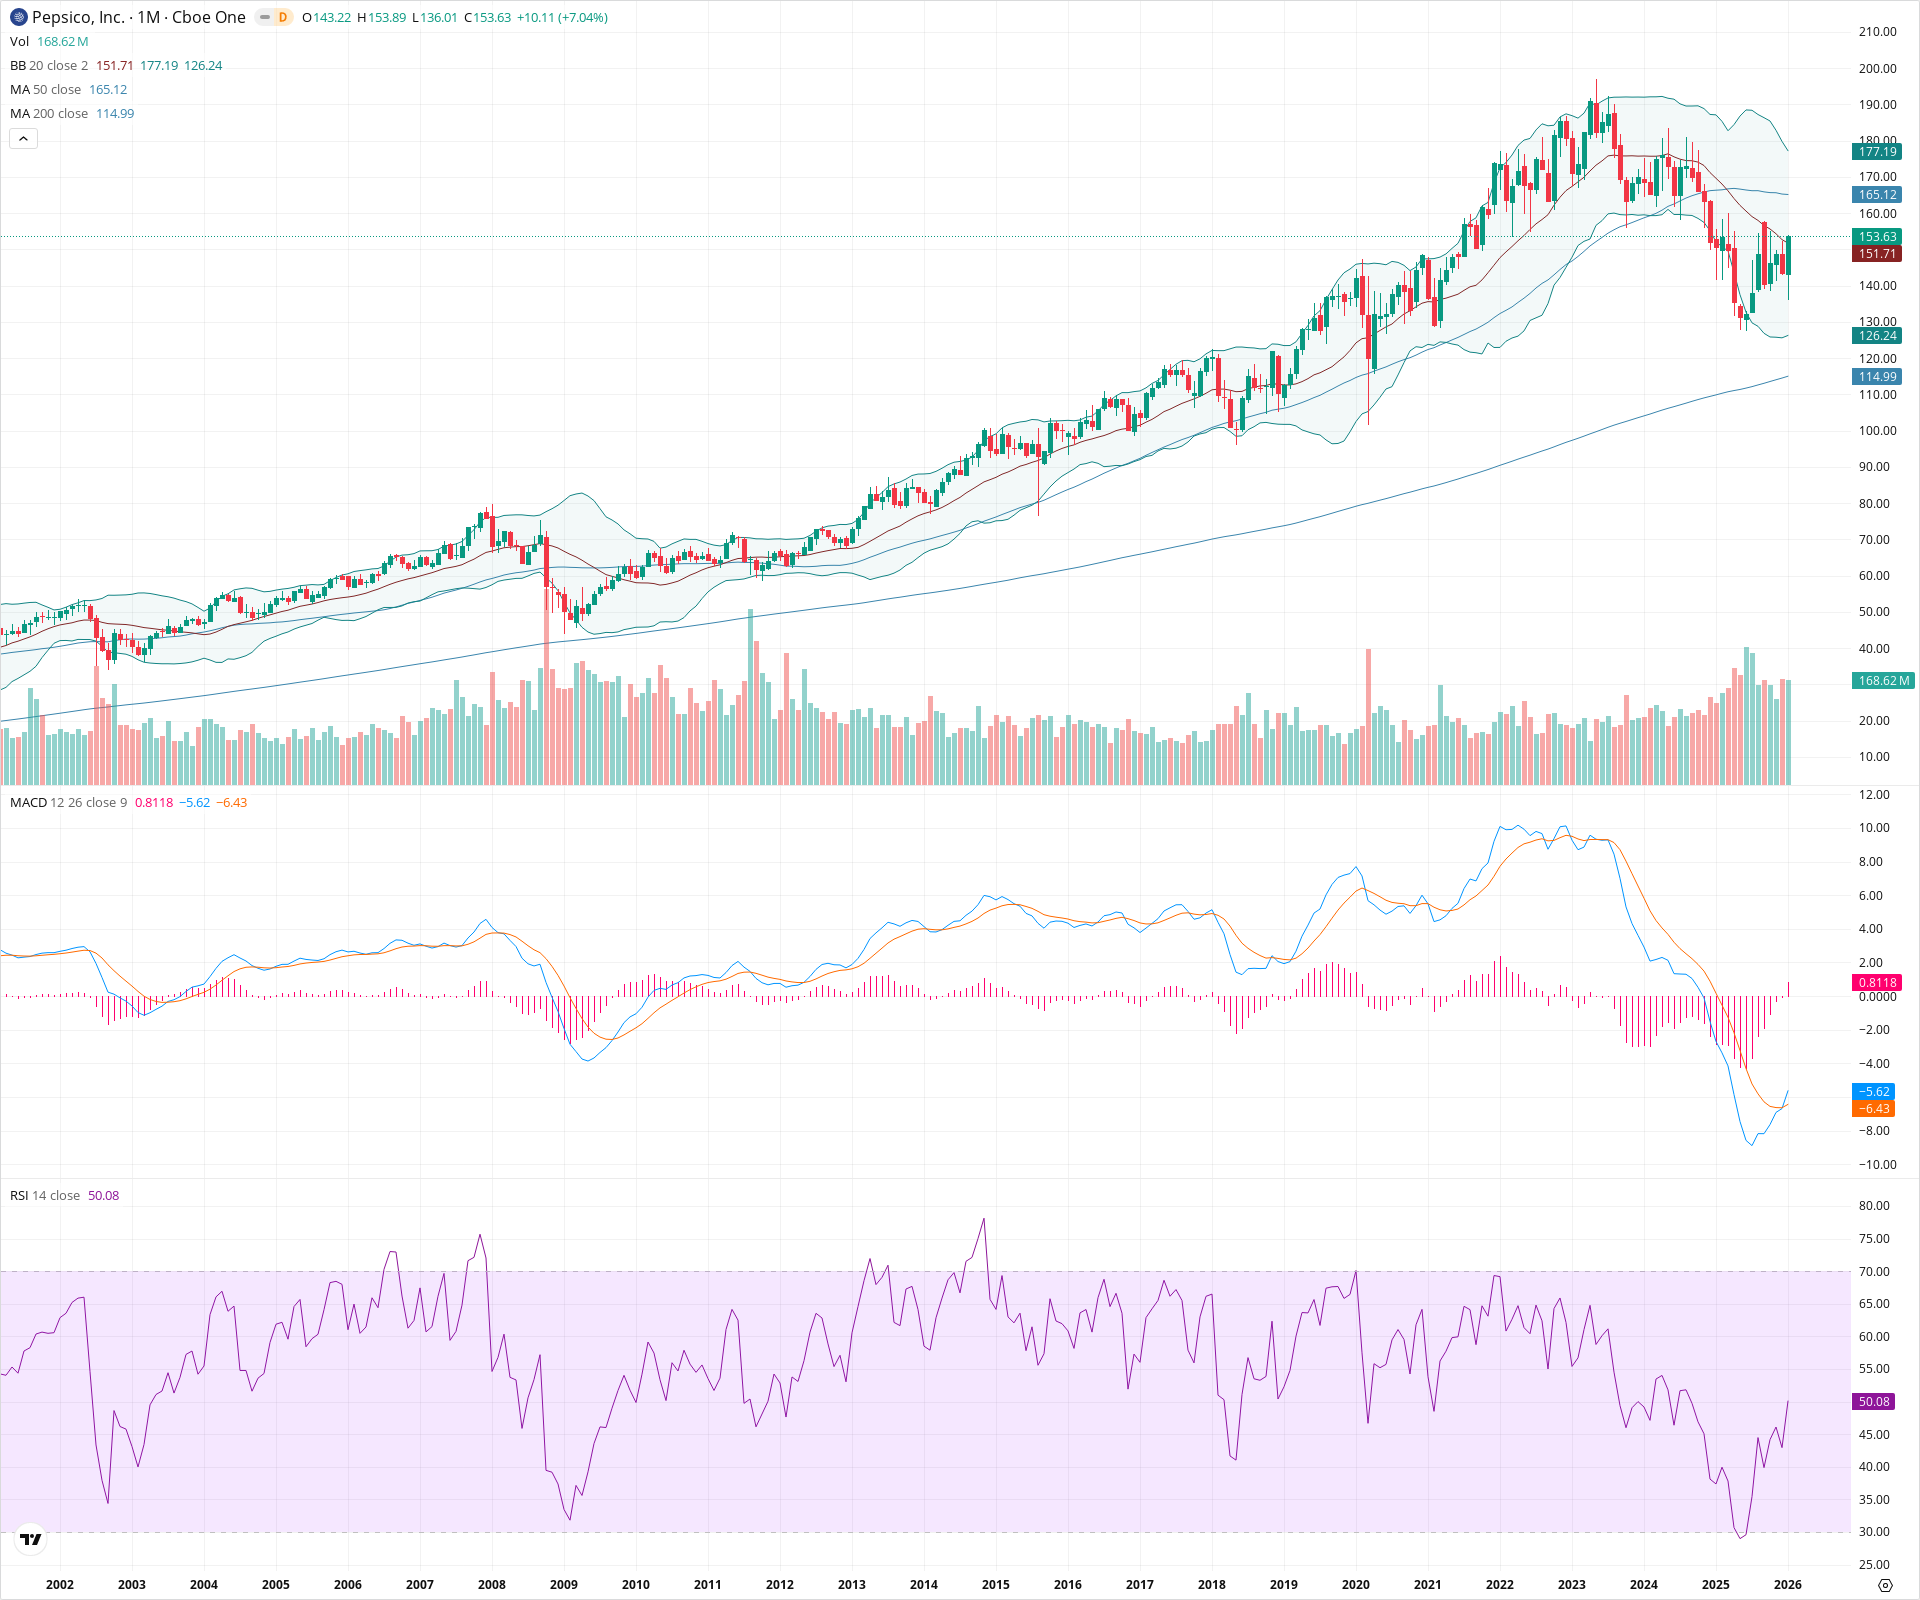
PEP Monthly Chart
Sentiment
Short-term Sentiment (days to weeks): Bullish
The current monthly candle shows a strong rejection of lows at 136.01, creating a large bullish body that has reclaimed the 20-month SMA (151.71). Additionally, the MACD histogram has turned positive with a bullish crossover, and the RSI has recovered to the neutral 50 level.
Long-term Sentiment (weeks to months): Neutral
While the long-term secular trend remains intact (price is well above the rising 200-month SMA), the stock remains below the critical 50-month SMA (165.12), indicating the medium-term structural correction is not yet fully resolved.
Report Metadata
- Timeframe: monthly
- Generated at: 2026-02-02T06:56:11.743Z
- Model: gemini-3-pro-preview
Support Price Levels
| Level | Range | Strength | Notes |
|---|---|---|---|
| $138.01 | $136.01 - $140.00 | Strong | Recent swing low and the bottom of the current strong reversal candle. |
| $128.00 | $126.00 - $130.00 | Strong | Aligns with the Lower Bollinger Band (126.24) and major pre-2020 consolidation zones. |
| $112.50 | $110.00 - $115.00 | Strong | Primary secular support coinciding with the 200-month SMA (114.99). |
Resistance Price Levels
| Level | Range | Strength | Notes |
|---|---|---|---|
| $165.50 | $165.00 - $166.00 | Strong | Convergence of the 50-month SMA (165.12), acting as the primary overhead hurdle. |
| $178.50 | $177.00 - $180.00 | Weak | Upper Bollinger Band (177.19) and previous price congestion area. |
| $193.50 | $190.00 - $197.00 | Strong | All-time high resistance zone established during the 2023 peak. |
Potential Chart Patterns in Formation
| Strength | Pattern | Signal | Target | Details |
|---|---|---|---|---|
| Strong | Bullish Reversal / V-Bottom | Bullish | $165.12 | Following a prolonged correction from 2023 highs, price action shows a sharp V-shaped recovery in the current month, rejecting the 136 level and breaking back above the 20-month SMA. |
Frequently Asked Questions about PEP
What is the current sentiment for PEP?
The short-term sentiment for PEP is currently Bullish because The current monthly candle shows a strong rejection of lows at 136.01, creating a large bullish body that has reclaimed the 20-month SMA (151.71). Additionally, the MACD histogram has turned positive with a bullish crossover, and the RSI has recovered to the neutral 50 level.. The long-term trend is classified as Neutral.
What are the key support levels for PEP?
StockDips.AI has identified key support levels for PEP at $138.01 and $128.00. These levels may represent potential accumulation zones where buying interest could emerge.
Is PEP in a significant dip or a Value Dip right now?
PEP has a Value Score of 65/100. It is not currently flagged as a significant dip in the Top Dips list. It is not listed as a Value Dip because the long-term sentiment or value-score threshold does not qualify.
View the full interactive analysis on StockDips.AI.