PG Monthly Technical Analysis
Procter & Gamble
Consumer staples leader (Tide, Pampers, Gillette, Olay)
PG Technical Analysis Summary
Procter & Gamble is currently navigating a multi-year consolidation phase within a larger secular bull market, defined by support near 125-140 and resistance near 160-180. While the long-term trend remains positive above the 200-month SMA, the medium-term outlook is cautious as price trades below the 20 and 50-month averages with negative MACD momentum. A sustained monthly close above 162 is needed to confirm a return to bullish dominance, whereas a failure to hold the 137-142 zone could invite a retest of the major structural lows around 122.
Included In Lists
Related Tickers of Interest
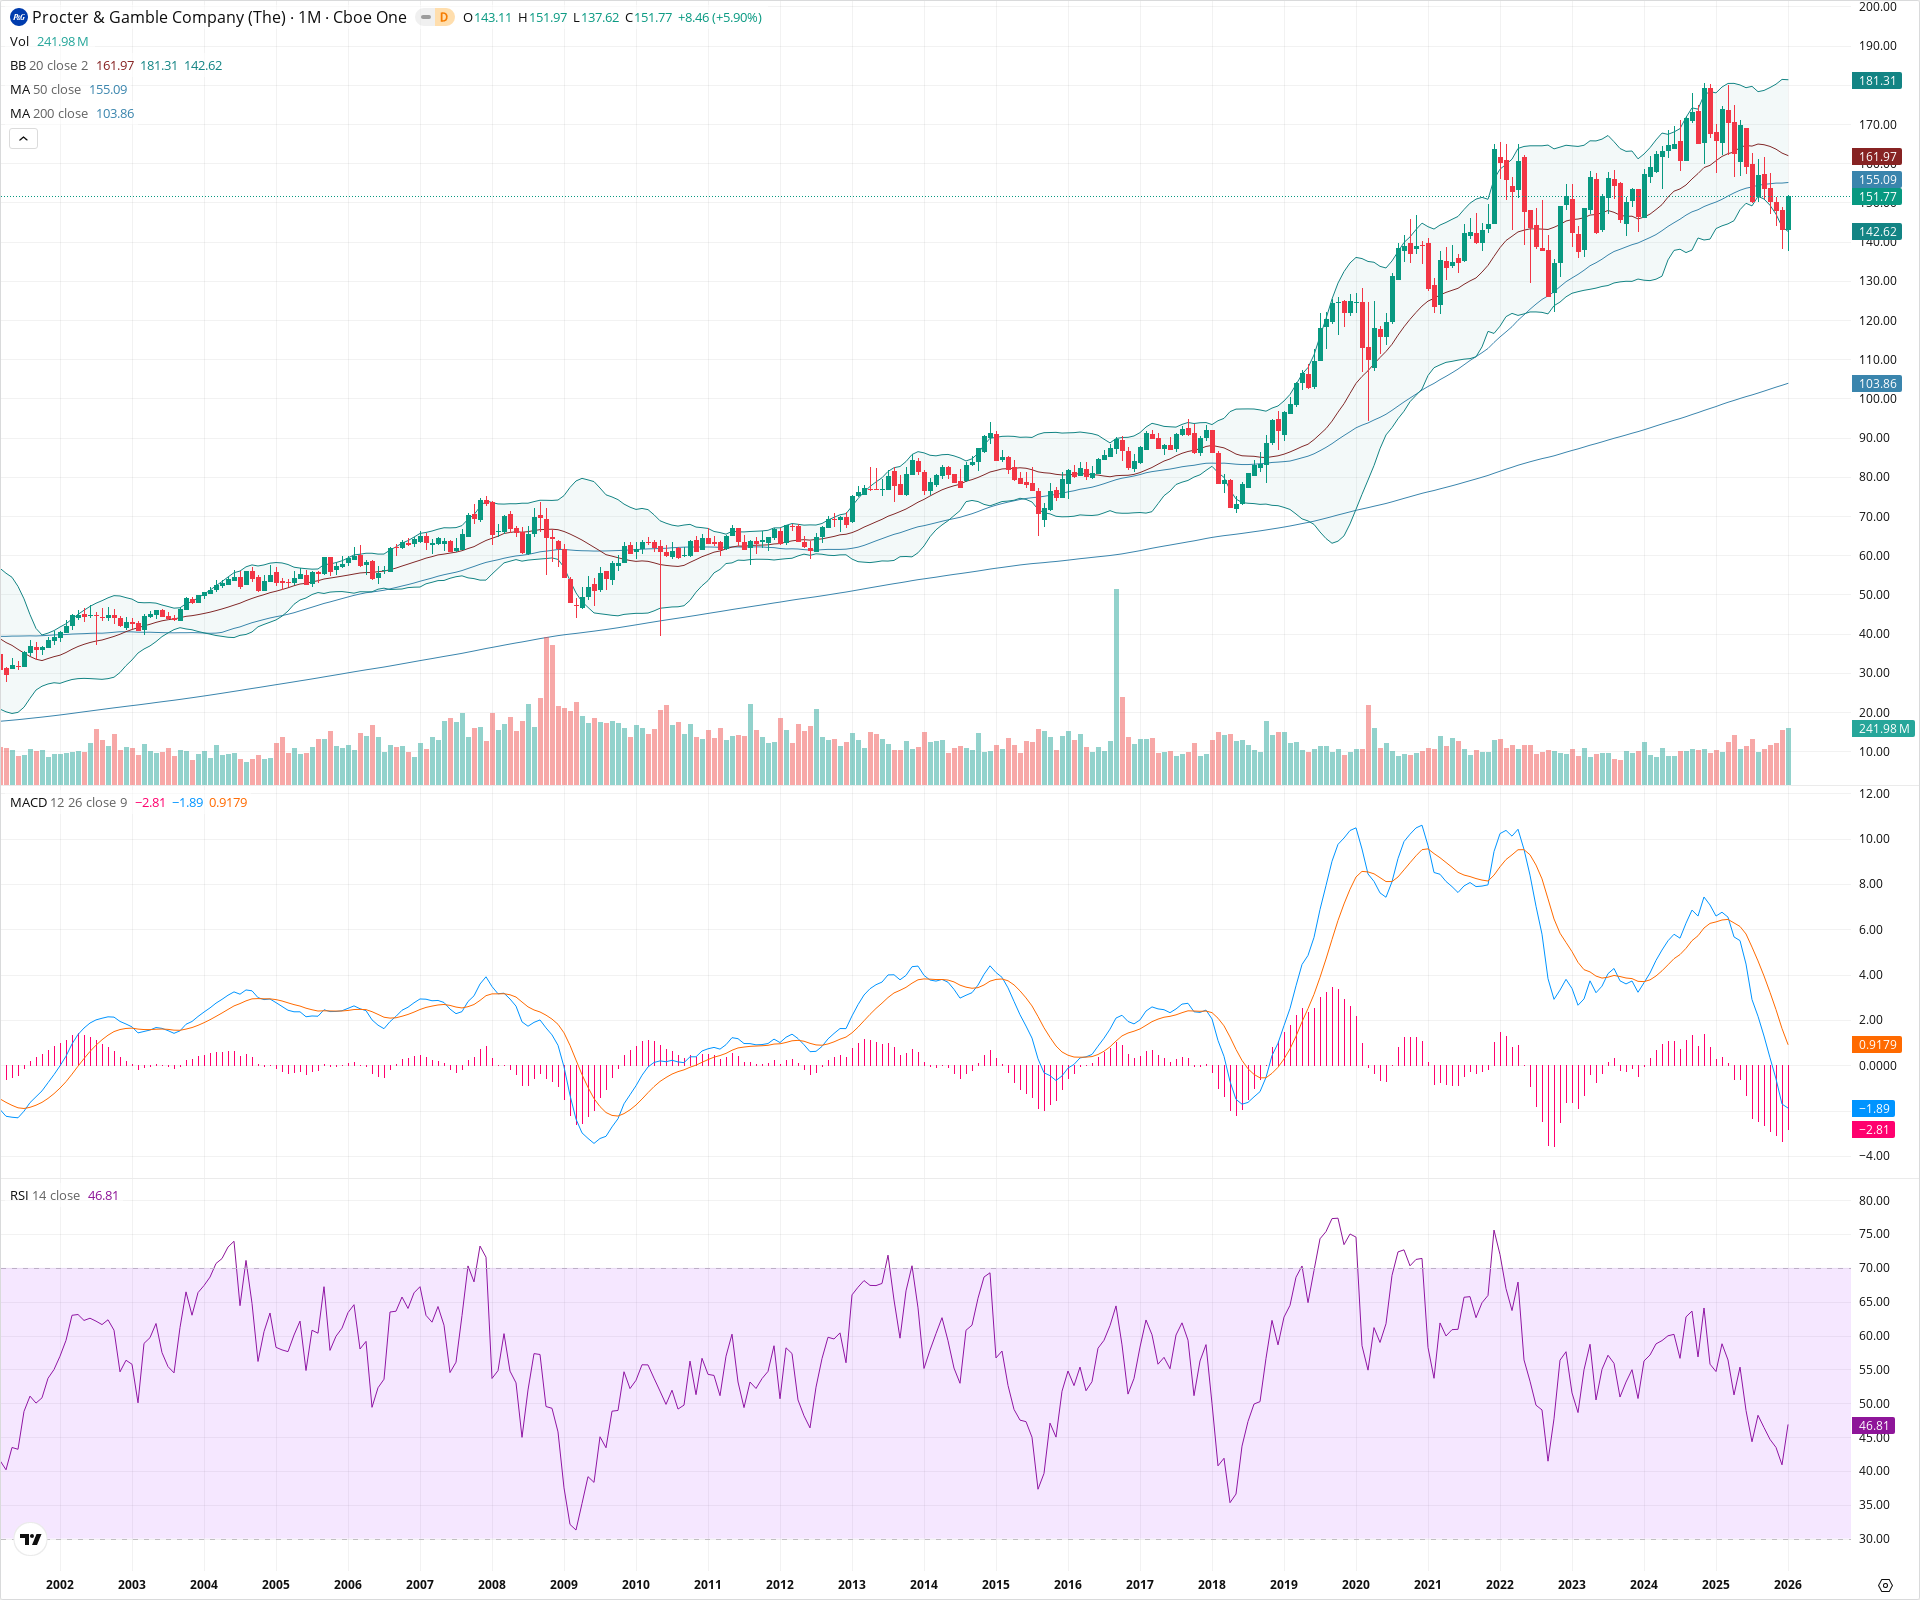
PG Monthly Chart
Sentiment
Short-term Sentiment (days to weeks): Neutral
Price is staging a strong monthly rebound from the lower Bollinger Band support, but remains below the critical 20-month and 50-month SMAs. Additionally, the MACD is in negative territory with the signal line above the MACD line, indicating ongoing medium-term bearish momentum despite the current bounce.
Long-term Sentiment (weeks to months): Bullish
The stock remains in a clear secular uptrend, trading well above the 200-month SMA. The price action since 2022 represents a broad high-level consolidation rather than a trend reversal, suggesting the long-term bullish structure is intact.
Report Metadata
- Timeframe: monthly
- Generated at: 2026-02-02T06:56:22.414Z
- Model: gemini-3-pro-preview
Support Price Levels
| Level | Range | Strength | Notes |
|---|---|---|---|
| $140.12 | $137.62 - $142.62 | Strong | Immediate support zone formed by the current month's low and the lower Bollinger Band. |
| $125.00 | $122.00 - $128.00 | Strong | Major structural swing lows established during the corrections in late 2020 and 2022. |
| $103.50 | $103.00 - $104.00 | Strong | Long-term secular support at the 200-month SMA. |
Resistance Price Levels
| Level | Range | Strength | Notes |
|---|---|---|---|
| $158.53 | $155.09 - $161.97 | Strong | Significant overhead resistance cluster consisting of the 50-month SMA and the 20-month SMA (Bollinger Band basis). |
| $178.16 | $175.00 - $181.31 | Strong | Upper boundary of the multi-year trading range and the upper Bollinger Band. |
Potential Chart Patterns in Formation
| Strength | Pattern | Signal | Target | Details |
|---|---|---|---|---|
| Strong | Broad Consolidation Channel | Neutral | N/A | Since early 2022, the price has been oscillating in a wide sideways range roughly between 125 and 175, digesting the previous multi-year rally. |
Frequently Asked Questions about PG
What is the current sentiment for PG?
The short-term sentiment for PG is currently Neutral because Price is staging a strong monthly rebound from the lower Bollinger Band support, but remains below the critical 20-month and 50-month SMAs. Additionally, the MACD is in negative territory with the signal line above the MACD line, indicating ongoing medium-term bearish momentum despite the current bounce.. The long-term trend is classified as Bullish.
What are the key support levels for PG?
StockDips.AI has identified key support levels for PG at $140.12 and $125.00. These levels may represent potential accumulation zones where buying interest could emerge.
Is PG in a significant dip or a Value Dip right now?
PG has a Value Score of 43/100. It is not currently flagged as a significant dip in the Top Dips list. It is not listed as a Value Dip because the long-term sentiment or value-score threshold does not qualify.
View the full interactive analysis on StockDips.AI.