SMCI Monthly Technical Analysis
Super Micro Computer Inc
Builds high-performance servers and storage used in AI and cloud computing.
SMCI Technical Analysis Summary
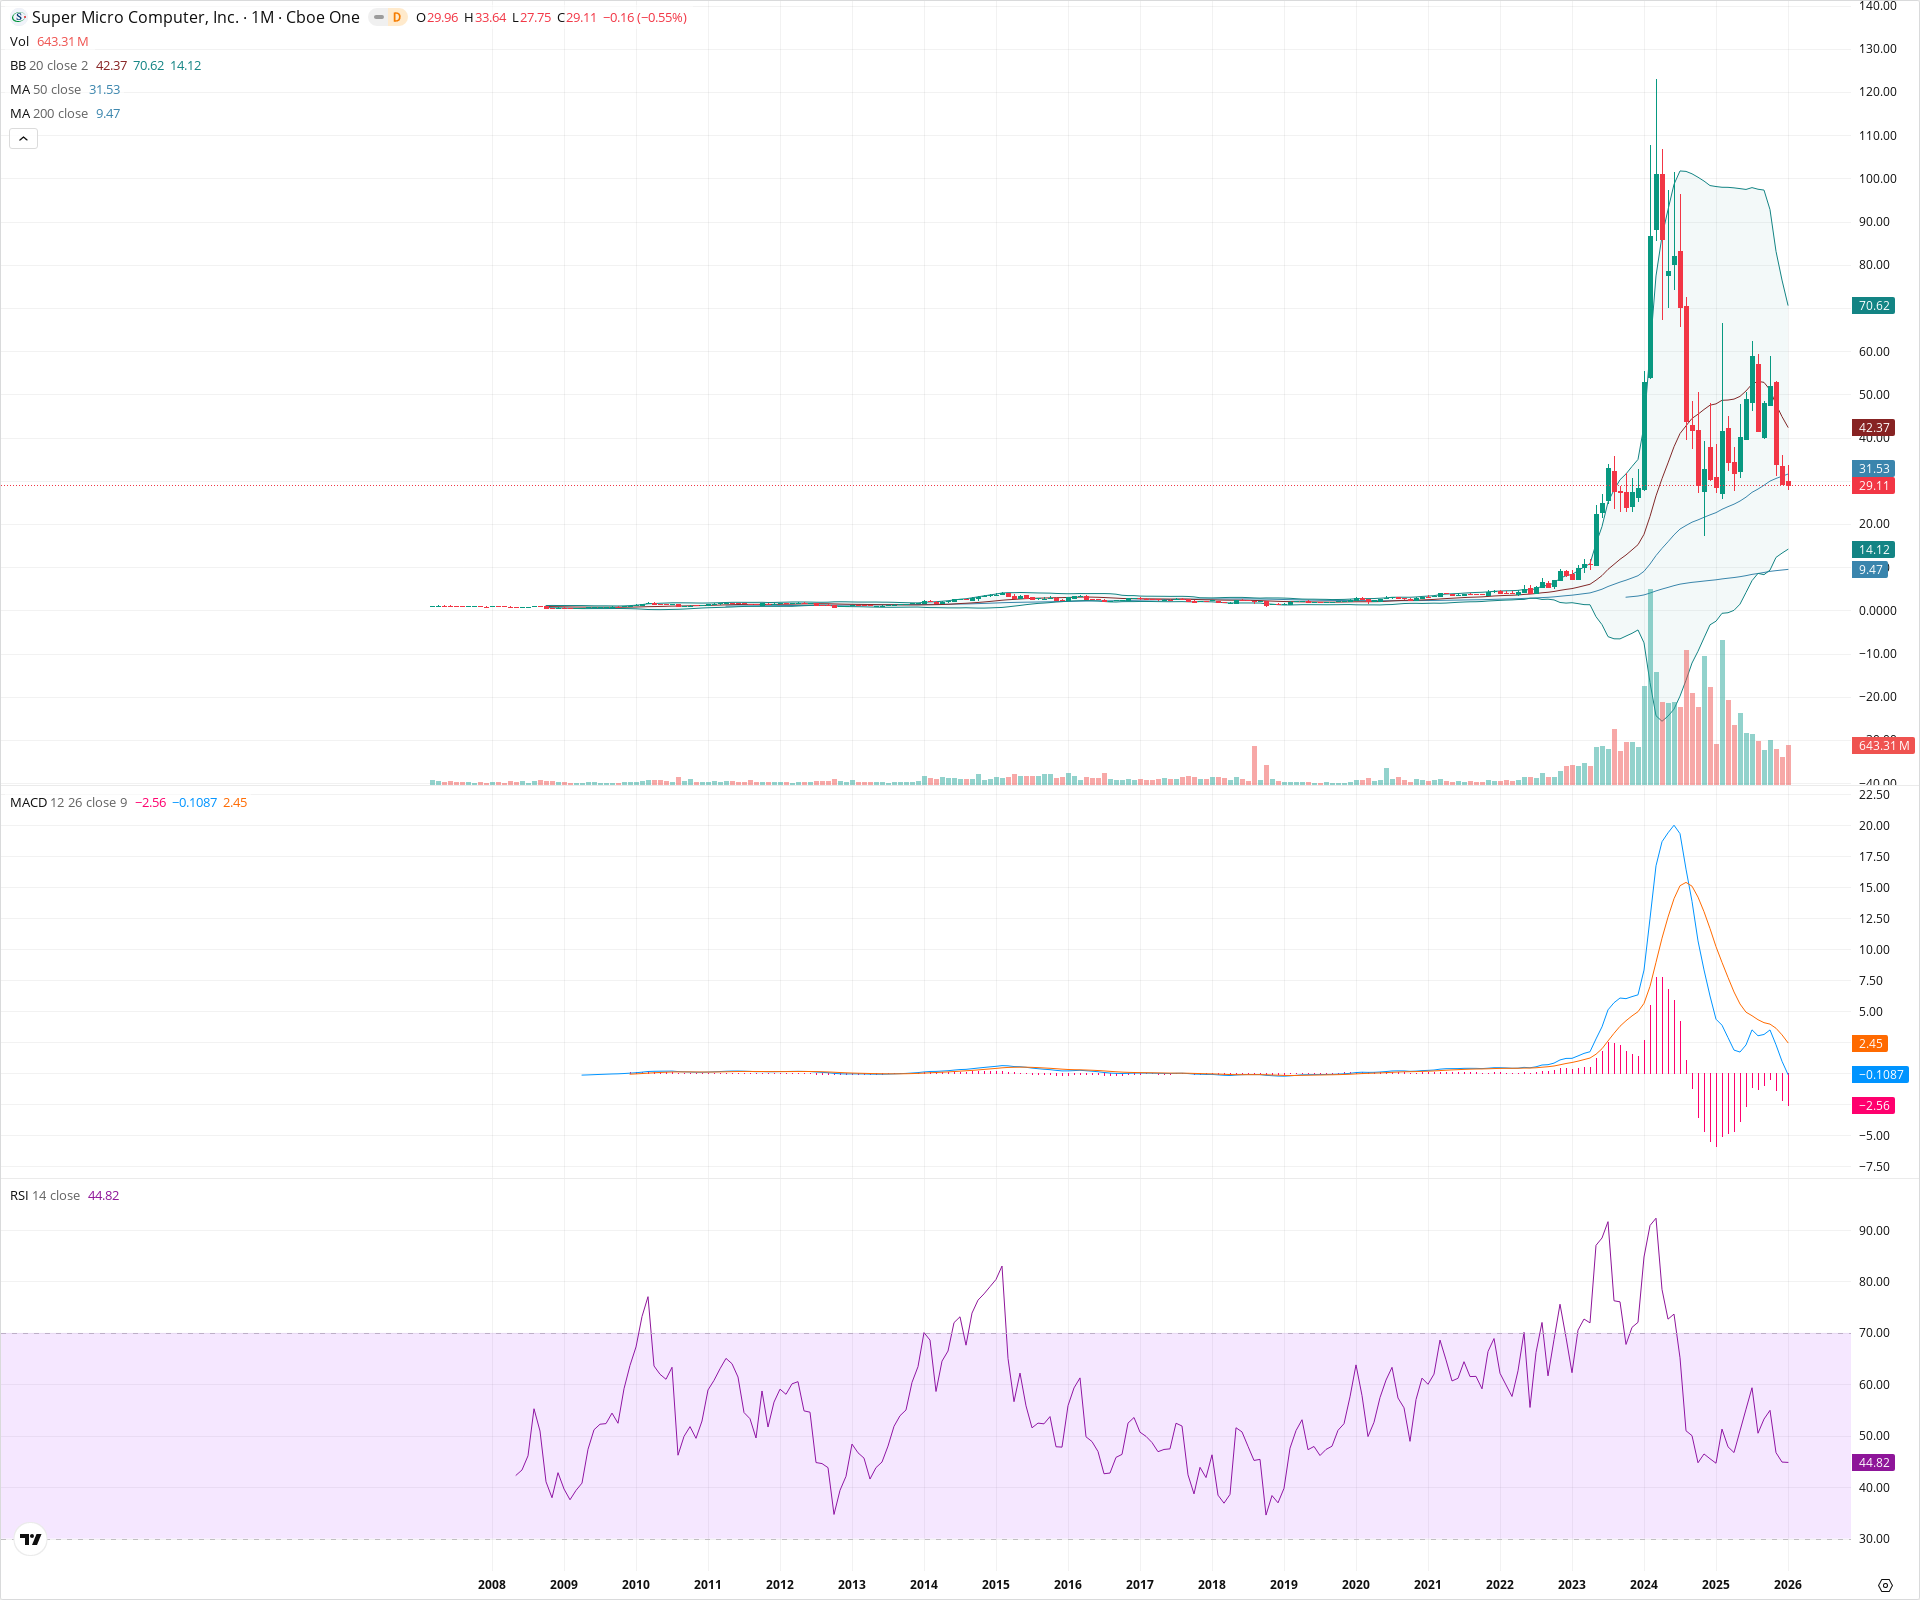
SMCI exhibits a classic boom-bust cycle on the monthly timeframe, with a massive parabolic rally that has completely reversed. The price action has damaged the long-term technical structure by breaking the 20-month and 50-month SMAs, confirmed by a bearish MACD crossover. The stock is currently in a price discovery phase seeking a secular bottom, likely near the 200-month SMA or the historical breakout base.
Included In Lists
Related Tickers of Interest
SMCI Monthly Chart
Sentiment
Short-term Sentiment (days to weeks): Bearish
Price is in a steep vertical decline, having recently closed below the 50-month SMA. The MACD shows a fresh bearish crossover with expanding negative histogram momentum.
Long-term Sentiment (weeks to months): Bearish
The stock has suffered a catastrophic parabolic blow-off top, retracing over 70% from its highs. While the 200-month SMA remains upward sloping, the loss of the 20 and 50-month SMAs signals a major secular regime change from bull to bear/repair.
Report Metadata
- Timeframe: monthly
- Generated at: 2026-02-02T06:57:28.429Z
- Model: gemini-3-pro-preview
Support Price Levels
| Level | Range | Strength | Notes |
|---|---|---|---|
| $22.00 | $20.00 - $24.00 | Weak | Zone of minor consolidation during the early ascent of the 2023 rally. |
| $14.10 | $14.00 - $14.20 | Strong | Aligns with the current monthly Lower Bollinger Band (14.12). |
| $9.50 | $9.00 - $10.00 | Strong | Major structural floor defined by the 200-month SMA (9.47) and the multi-year breakout base. |
Resistance Price Levels
| Level | Range | Strength | Notes |
|---|---|---|---|
| $31.75 | $31.50 - $32.00 | Strong | The 50-month SMA, recently breached, now acting as immediate overhead resistance. |
| $42.50 | $42.00 - $43.00 | Strong | The 20-month SMA (Bollinger middle band); a key trend-following level that has been lost. |
| $75.00 | $70.00 - $80.00 | Weak | Distant resistance at the Upper Bollinger Band and midpoint of the crash. |
Potential Chart Patterns in Formation
| Strength | Pattern | Signal | Target | Details |
|---|---|---|---|---|
| Strong | Parabolic Blow-off Top | Bearish | N/A | A vertical price ascent to ~122 followed by an immediate and violent collapse, characteristic of a bubble burst. |
Frequently Asked Questions about SMCI
What is the current sentiment for SMCI?
The short-term sentiment for SMCI is currently Bearish because Price is in a steep vertical decline, having recently closed below the 50-month SMA. The MACD shows a fresh bearish crossover with expanding negative histogram momentum.. The long-term trend is classified as Bearish.
What are the key support levels for SMCI?
StockDips.AI has identified key support levels for SMCI at $22.00 and $14.10. These levels may represent potential accumulation zones where buying interest could emerge.
Is SMCI in a significant dip or a Value Dip right now?
SMCI has a Value Score of 55/100. It is not currently flagged as a significant dip in the Top Dips list. It is not listed as a Value Dip because the long-term sentiment or value-score threshold does not qualify.
View the full interactive analysis on StockDips.AI.