TGT Monthly Technical Analysis
Target Corporation
Large U.S. retail chain offering general merchandise, apparel, home goods, groceries, and essentials through 1,900+ stores and a strong omni-channel platform.
TGT Technical Analysis Summary
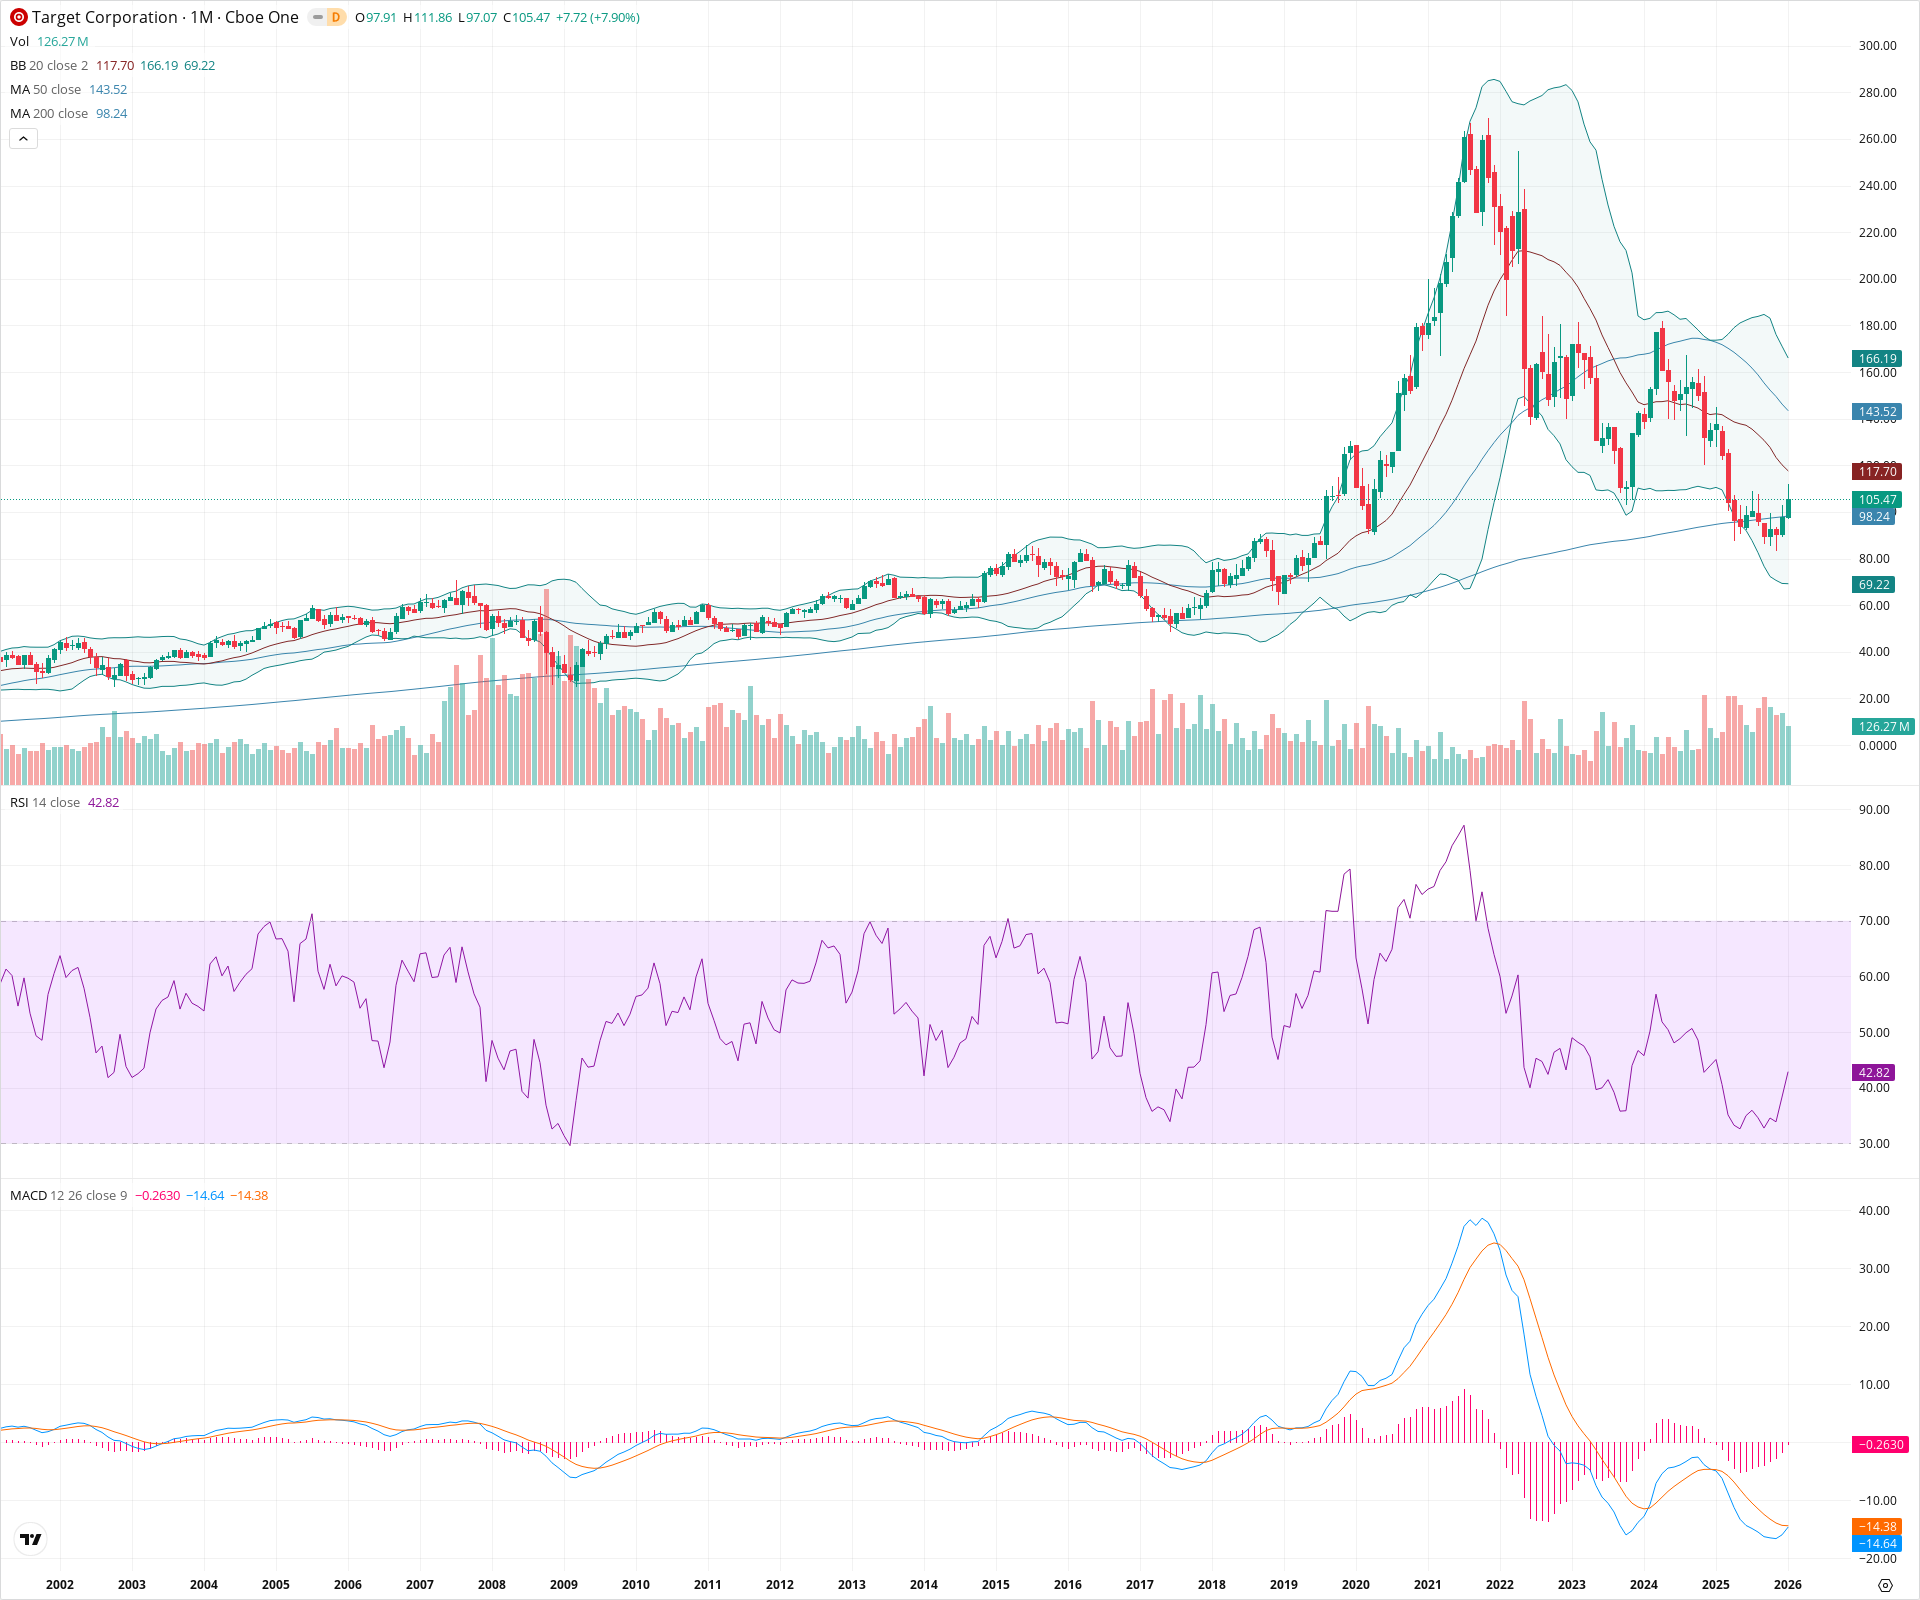
Target Corporation is currently navigating a critical test of its secular trend at the 200-month moving average following a severe multi-year correction. While the long-term structure remains bearish with price below the 50-month SMA and momentum indicators in negative territory, the immediate bounce off the 200-month SMA suggests potential stabilization. A sustained move above the 20-month and 50-month SMAs is required to confirm a reversal of the macro downtrend.
Included In Lists
Related Tickers of Interest
TGT Monthly Chart
Sentiment
Short-term Sentiment (days to weeks): Bullish
The price is showing a strong reaction to the 200-month SMA support level with a significant monthly green candle (+7.90%), suggesting buyers are defending this long-term value zone.
Long-term Sentiment (weeks to months): Bearish
The stock remains in a defined secular downtrend from the 2021 highs, trading below the key 50-month SMA and the middle Bollinger Band. The MACD is deeply negative, confirming a dominant bearish regime despite the recent pause.
Report Metadata
- Timeframe: monthly
- Generated at: 2026-02-02T06:58:35.377Z
- Model: gemini-3-pro-preview
Support Price Levels
| Level | Range | Strength | Notes |
|---|---|---|---|
| $97.62 | $97.00 - $98.24 | Strong | Confluence of the 200-month SMA (98.24) and recent monthly lows. |
| $72.00 | $69.00 - $75.00 | Strong | Lower Bollinger Band area and major structural support from pre-2019 consolidation. |
Resistance Price Levels
| Level | Range | Strength | Notes |
|---|---|---|---|
| $117.50 | $117.00 - $118.00 | Weak | 20-month SMA (Bollinger Band basis) acting as immediate dynamic resistance. |
| $144.00 | $143.00 - $145.00 | Strong | 50-month SMA and a zone of previous price consolidation. |
| $173.00 | $166.00 - $180.00 | Strong | Upper Bollinger Band and major breakdown level from the 2022 decline. |
Potential Chart Patterns in Formation
| Strength | Pattern | Signal | Target | Details |
|---|---|---|---|---|
| Strong | Secular Correction | Bearish | N/A | A multi-year decline from the 2021 all-time highs characterized by lower highs and lower lows. |
| Strong | 200 MA Support Test | Neutral | N/A | Price is currently testing the 200-month Simple Moving Average, a critical secular trend indicator that often defines the long-term floor. |
Frequently Asked Questions about TGT
What is the current sentiment for TGT?
The short-term sentiment for TGT is currently Bullish because The price is showing a strong reaction to the 200-month SMA support level with a significant monthly green candle (+7.90%), suggesting buyers are defending this long-term value zone.. The long-term trend is classified as Bearish.
What are the key support levels for TGT?
StockDips.AI has identified key support levels for TGT at $97.62 and $72.00. These levels may represent potential accumulation zones where buying interest could emerge.
Is TGT in a significant dip or a Value Dip right now?
TGT has a Value Score of 55/100. It is not currently flagged as a significant dip in the Top Dips list. It is not listed as a Value Dip because the long-term sentiment or value-score threshold does not qualify.
View the full interactive analysis on StockDips.AI.