AAOI Daily Technical Analysis
Applied Optoelectronics, Inc
Applied Optoelectronics, Inc. (AAOI) designs and manufactures advanced fiber-optic networking products, specifically high-speed optical transceivers and laser components that convert electrical signals into light to move massive volumes of data inside internet data centers, cloud networks, and cable television systems.
AAOI Technical Analysis Summary
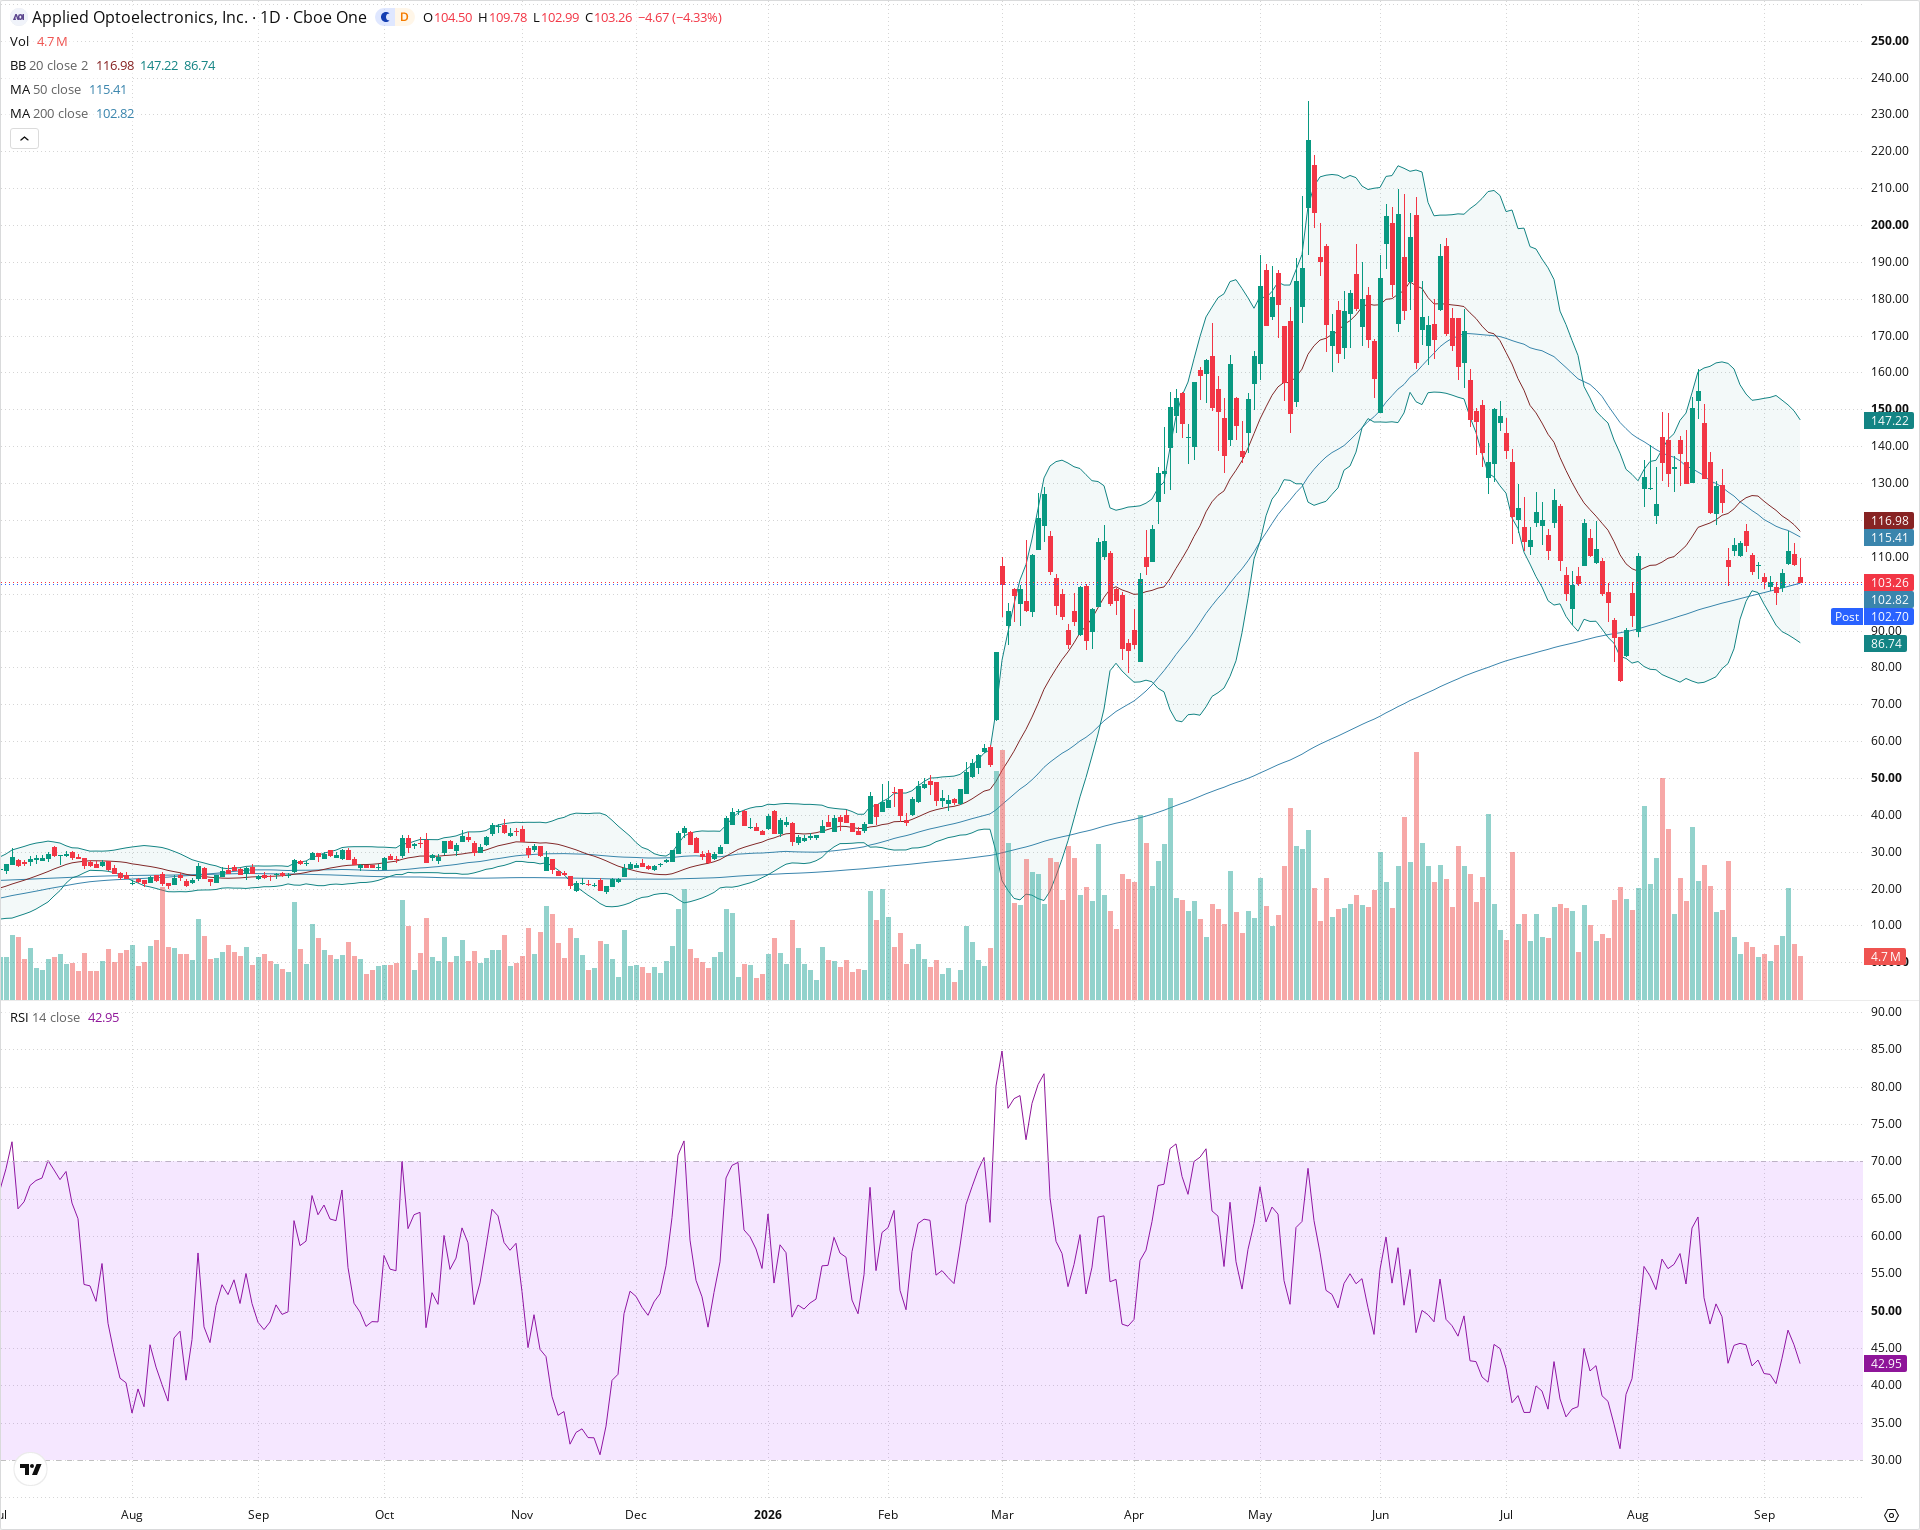
AAOI has retraced the majority of its massive early-year advance and is currently testing critical support at its 200-day moving average near 103. The short-term trend remains pressured by overhead resistance at the 20-day and 50-day moving averages (115-117) and an RSI reading below 50. A decisive breakdown below the 100-103 threshold would signal a continuation toward the August swing lows near 80, while holding this level could allow for consolidation.
Included In Lists
Related Tickers of Interest
AAOI Daily Chart
Sentiment
Short-term Sentiment (days to weeks): Bearish
Price is trading below both the 20-day and 50-day moving averages following a failed bounce, with RSI remaining below 50.
Long-term Sentiment (weeks to months): Neutral
Price has retraced significantly from the 240 peak to test the rising 200-day SMA, where it currently sits at a crucial long-term trend juncture.
Report Metadata
- Timeframe: daily
- Generated at: 2026-09-10T20:21:02.918Z
- Model: gemini-3.8-flash
Support Price Levels
| Level | Range | Strength | Notes |
|---|---|---|---|
| $101.50 | $100.00 - $103.00 | Strong | Confluence of the rising 200-day simple moving average (102.82) and the psychological 100 benchmark. |
| $83.50 | $80.00 - $87.00 | Moderate | Late July/early August swing low area and proximity to the lower Bollinger Band. |
Resistance Price Levels
| Level | Range | Strength | Notes |
|---|---|---|---|
| $116.25 | $115.00 - $117.50 | Strong | Cluster of the 50-day SMA (115.41) and the 20-day SMA middle Bollinger Band (116.98). |
| $155.00 | $150.00 - $160.00 | Moderate | Mid-August lower-high swing peak and upper Bollinger Band boundary. |
Potential Chart Patterns in Formation
| Strength | Pattern | Signal | Target | Details |
|---|---|---|---|---|
| Moderate | Bearish Continuation / Lower High | Bearish | $80.00 | After a sharp relief rally peaking near 160 in mid-August, the stock established a lower high and resumed downward momentum toward major support. |
Frequently Asked Questions about AAOI
What is the current sentiment for AAOI?
The short-term sentiment for AAOI is currently Bearish because Price is trading below both the 20-day and 50-day moving averages following a failed bounce, with RSI remaining below 50.. The long-term trend is classified as Neutral.
What are the key support levels for AAOI?
StockDips.AI has identified key support levels for AAOI at $101.50 and $83.50. These levels may represent potential accumulation zones where buying interest could emerge.
Is AAOI in a significant dip or a Value Dip right now?
AAOI has a Value Score of 87/100. It is currently flagged as a significant dip in the Top Dips list. It is not listed as a Value Dip because the long-term sentiment or value-score threshold does not qualify.
View the full interactive analysis on StockDips.AI.