DELL Daily Technical Analysis
Dell Technologies Inc.
Designs, manufactures, and sells personal computers, servers, data storage devices, and enterprise IT infrastructure including AI-optimized server solutions.
DELL Technical Analysis Summary
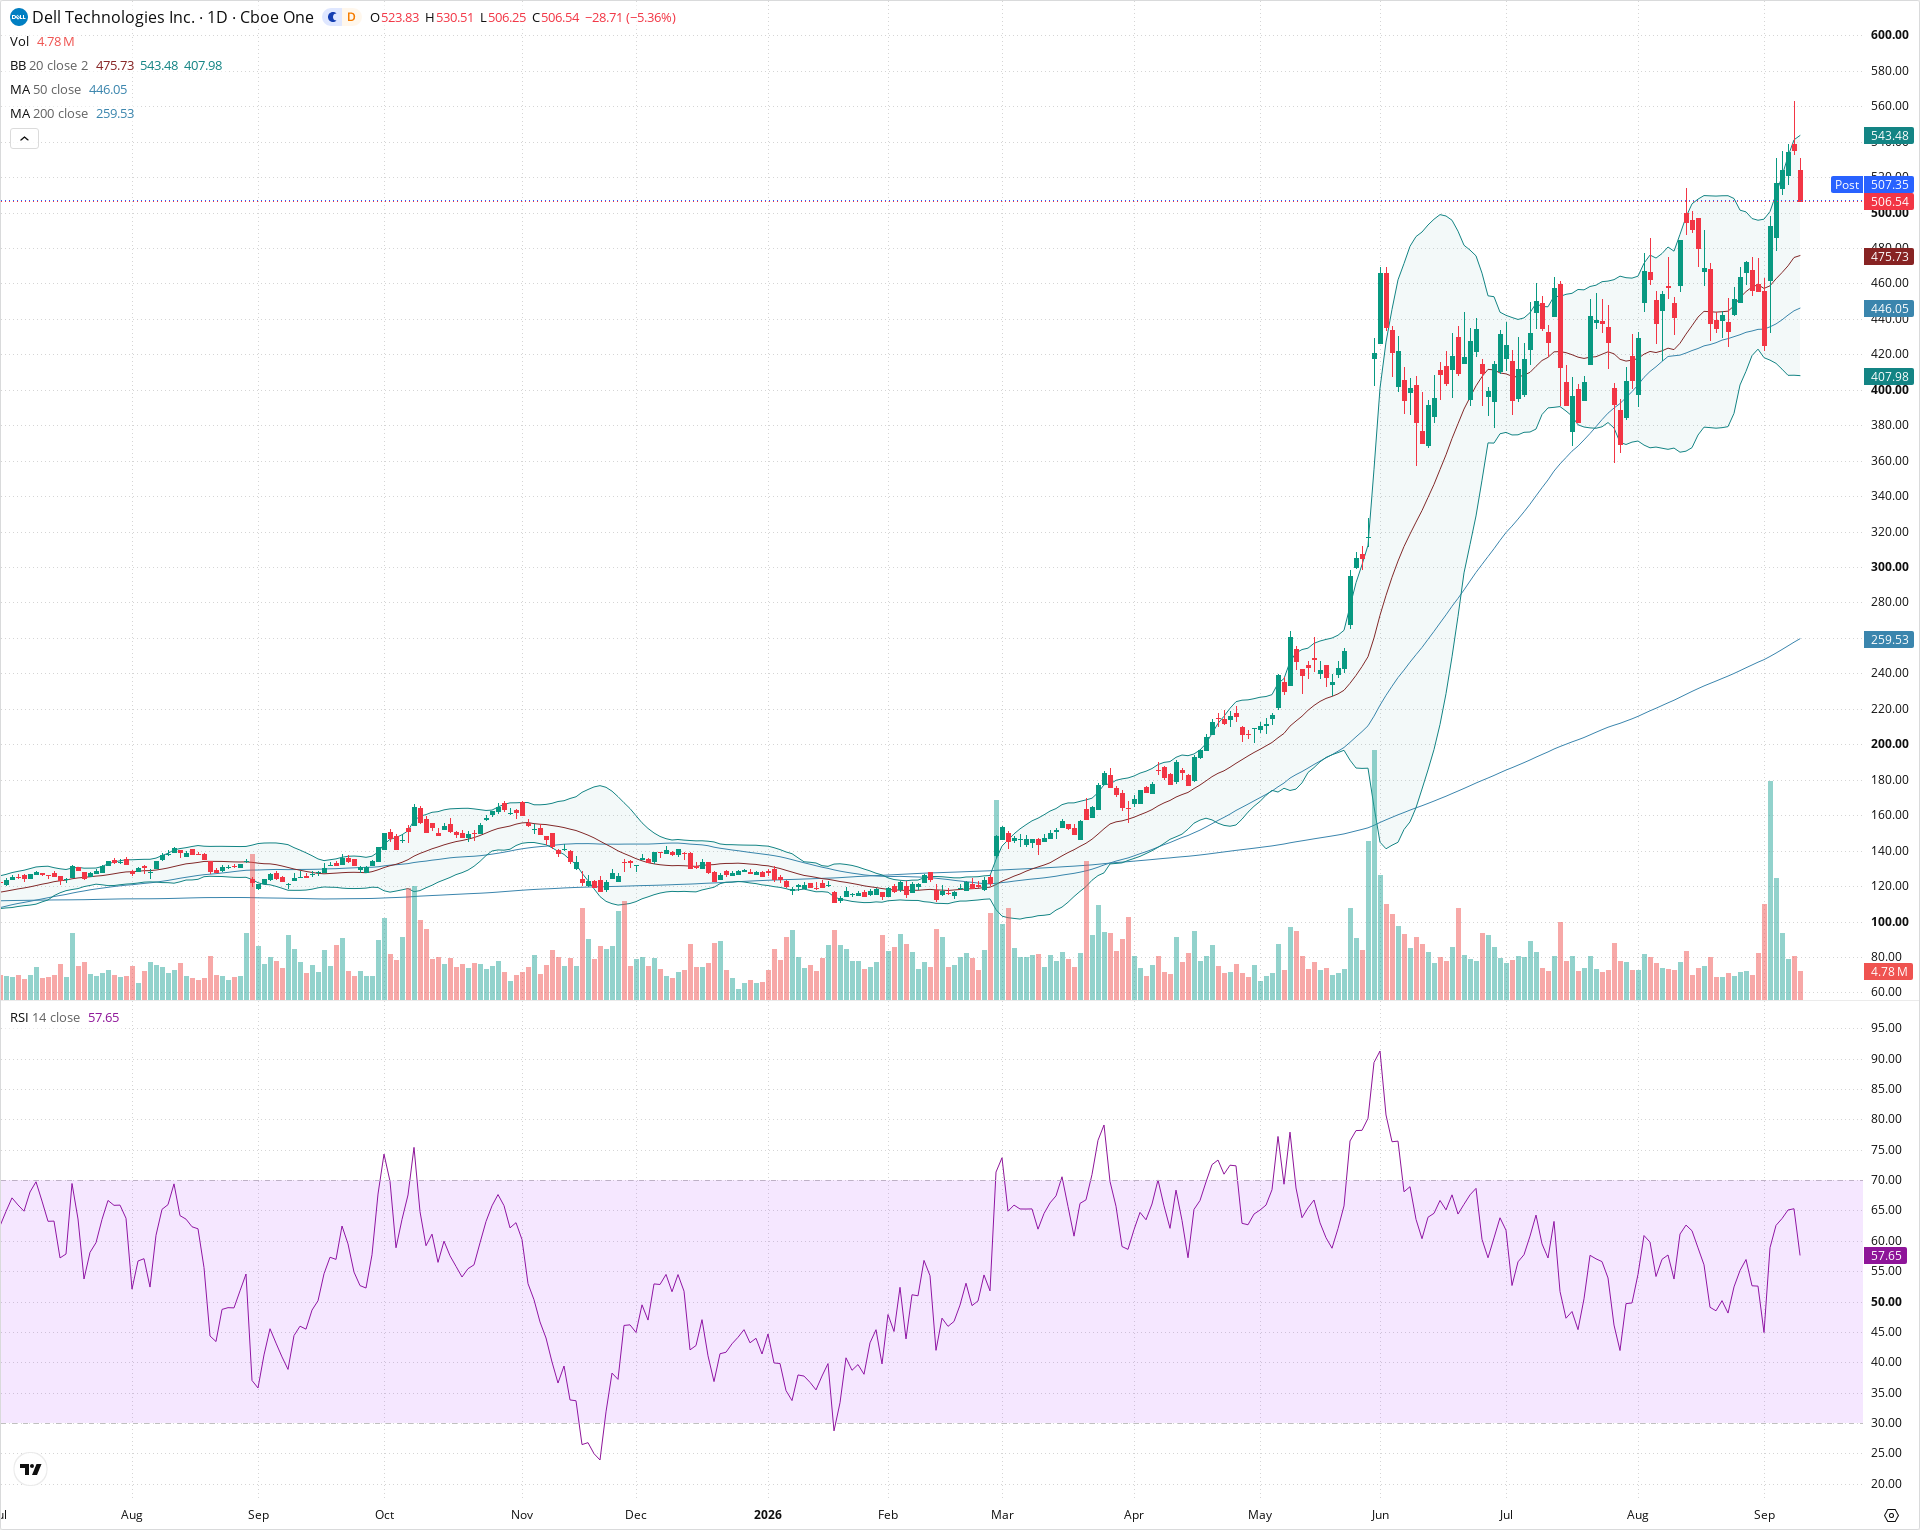
DELL remains in a powerful primary bull market, trading comfortably above upward-sloping 50-day and 200-day moving averages. In the short term, a sharp pullback from the 565 peak indicates a consolidation or mean-reversion phase toward the 20-day SMA near 475. As long as price holds above the primary support shelf around 440–448, the broader long-term uptrend remains firmly intact.
Included In Lists
Related Tickers of Interest
DELL Daily Chart
Sentiment
Short-term Sentiment (days to weeks): Neutral
Price faced a sharp rejection from the recent high near 565, forming a large bearish candle pulling back toward the 20-day moving average, with RSI declining to 57.65.
Long-term Sentiment (weeks to months): Bullish
The broader trend is strongly upward, with price trading substantially above rising 50-day (446.05) and 200-day (259.53) simple moving averages in an established sequence of higher highs.
Report Metadata
- Timeframe: daily
- Generated at: 2026-09-10T20:20:36.034Z
- Model: gemini-3.8-flash
Support Price Levels
| Level | Range | Strength | Notes |
|---|---|---|---|
| $473.00 | $470.00 - $476.00 | Moderate | Aligns with the 20-day SMA (475.73) and the mid-August consolidation shelf. |
| $444.00 | $440.00 - $448.00 | Strong | Confluence of the rising 50-day SMA (446.05) and previous horizontal resistance turned support. |
| $394.00 | $380.00 - $408.00 | Strong | Major structural swing low established in late July along with the lower Bollinger Band. |
Resistance Price Levels
| Level | Range | Strength | Notes |
|---|---|---|---|
| $537.00 | $530.00 - $544.00 | Moderate | Upper Bollinger Band boundary and intraday high zone from recent sessions. |
| $565.00 | $560.00 - $570.00 | Strong | Recent cycle peak wick acting as primary overhead resistance. |
Potential Chart Patterns in Formation
| Strength | Pattern | Signal | Target | Details |
|---|---|---|---|---|
| Moderate | Pullback from Upper Bollinger Band | Bearish | $475.73 | Price sharply reversed after tagging the upper Bollinger Band near 543-565, indicating short-term exhaustion and mean-reversion toward the 20-day SMA. |
| Strong | Ascending Trend | Bullish | $565.00 | Higher highs and higher lows have defined the intermediate trend since the late July swing low at 380. |
Frequently Asked Questions about DELL
What is the current sentiment for DELL?
The short-term sentiment for DELL is currently Neutral because Price faced a sharp rejection from the recent high near 565, forming a large bearish candle pulling back toward the 20-day moving average, with RSI declining to 57.65.. The long-term trend is classified as Bullish.
What are the key support levels for DELL?
StockDips.AI has identified key support levels for DELL at $473.00 and $444.00. These levels may represent potential accumulation zones where buying interest could emerge.
Is DELL in a significant dip or a Value Dip right now?
DELL has a Value Score of 47/100. It is not currently flagged as a significant dip in the Top Dips list. It is not listed as a Value Dip because the long-term sentiment or value-score threshold does not qualify.
View the full interactive analysis on StockDips.AI.