HPE Daily Technical Analysis
Hewlett Packard Enterprise
Provides enterprise technology solutions including cloud services, data center servers, storage, and networking hardware.
HPE Technical Analysis Summary
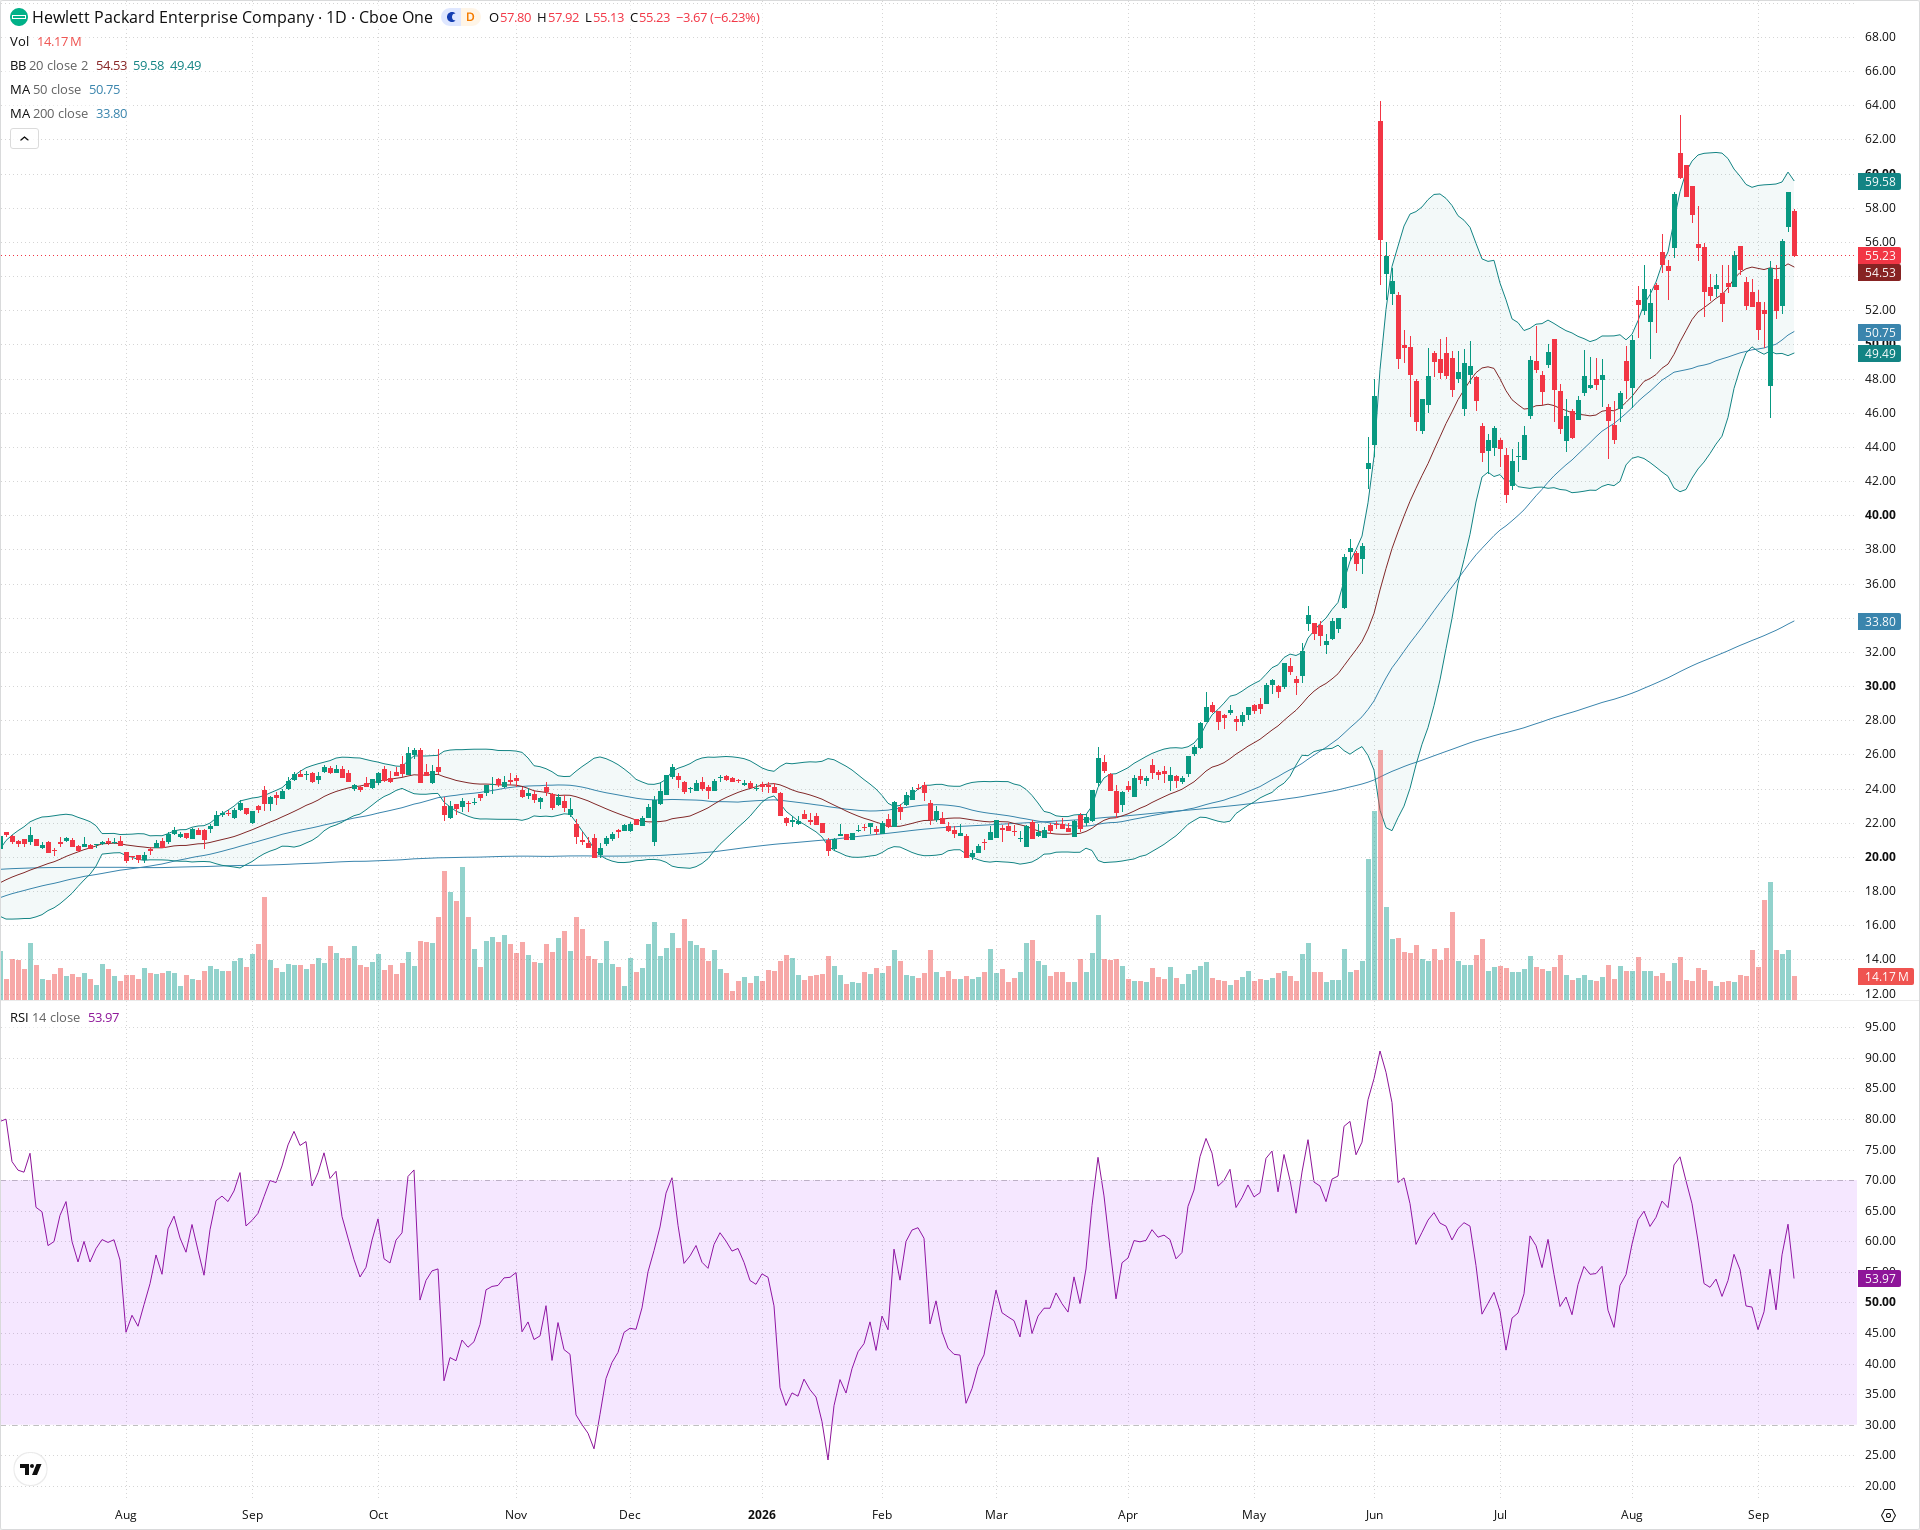
HPE remains firmly within a broader long-term uptrend supported by rising 50-day and 200-day moving averages. In the short term, the stock faces downward pressure following a sharp pullback from the 58.00 zone, testing initial support at the 20-day moving average near 54.50. Long-term investors should monitor whether the key 49.50–51.00 support area holds to maintain structural bullish momentum.
Included In Lists
Related Tickers of Interest
HPE Daily Chart
Sentiment
Short-term Sentiment (days to weeks): Bearish
Sharp single-day rejection candle (-6.23%) off resistance near the upper Bollinger band, bringing RSI down rapidly toward the midline.
Long-term Sentiment (weeks to months): Bullish
Well-defined macro uptrend characterized by price trading significantly above the rising 50-day (50.75) and 200-day (33.80) moving averages with higher long-term swing lows.
Report Metadata
- Timeframe: daily
- Generated at: 2026-09-10T20:16:38.982Z
- Model: gemini-3.8-flash
Support Price Levels
| Level | Range | Strength | Notes |
|---|---|---|---|
| $54.30 | $53.80 - $54.80 | Moderate | Aligns with the 20-day moving average (54.53) and recent short-term consolidation shelf. |
| $50.25 | $49.50 - $51.00 | Strong | Confluence of the rising 50-day moving average (50.75), lower Bollinger band (49.49), and late August reaction lows. |
| $43.00 | $42.00 - $44.00 | Strong | Major swing low established during the late June and early July consolidation base. |
Resistance Price Levels
| Level | Range | Strength | Notes |
|---|---|---|---|
| $58.70 | $57.80 - $59.60 | Moderate | Recent intraday peak and upper Bollinger band boundary near 59.58. |
| $62.90 | $62.00 - $63.80 | Strong | Multi-month ceiling formed by major highs from early June and mid-August. |
Potential Chart Patterns in Formation
| Strength | Pattern | Signal | Target | Details |
|---|---|---|---|---|
| Moderate | Double Top | Bearish | $44.00 | Two distinct structural peaks formed near 63.80 in June and 62.80 in August, signaling substantial distribution and heavy overhead resistance. |
Frequently Asked Questions about HPE
What is the current sentiment for HPE?
The short-term sentiment for HPE is currently Bearish because Sharp single-day rejection candle (-6.23%) off resistance near the upper Bollinger band, bringing RSI down rapidly toward the midline.. The long-term trend is classified as Bullish.
What are the key support levels for HPE?
StockDips.AI has identified key support levels for HPE at $54.30 and $50.25. These levels may represent potential accumulation zones where buying interest could emerge.
Is HPE in a significant dip or a Value Dip right now?
HPE has a Value Score of 79/100. It is currently flagged as a significant dip in the Top Dips list. It is also listed as a Value Dip because long-term sentiment is bullish.
View the full interactive analysis on StockDips.AI.