ADBE Weekly Technical Analysis
Adobe Inc.
Developer of creative and digital media software including Photoshop, Illustrator, Premiere, and Acrobat. A leader in cloud-based creative software and digital marketing platforms.
ADBE Technical Analysis Summary
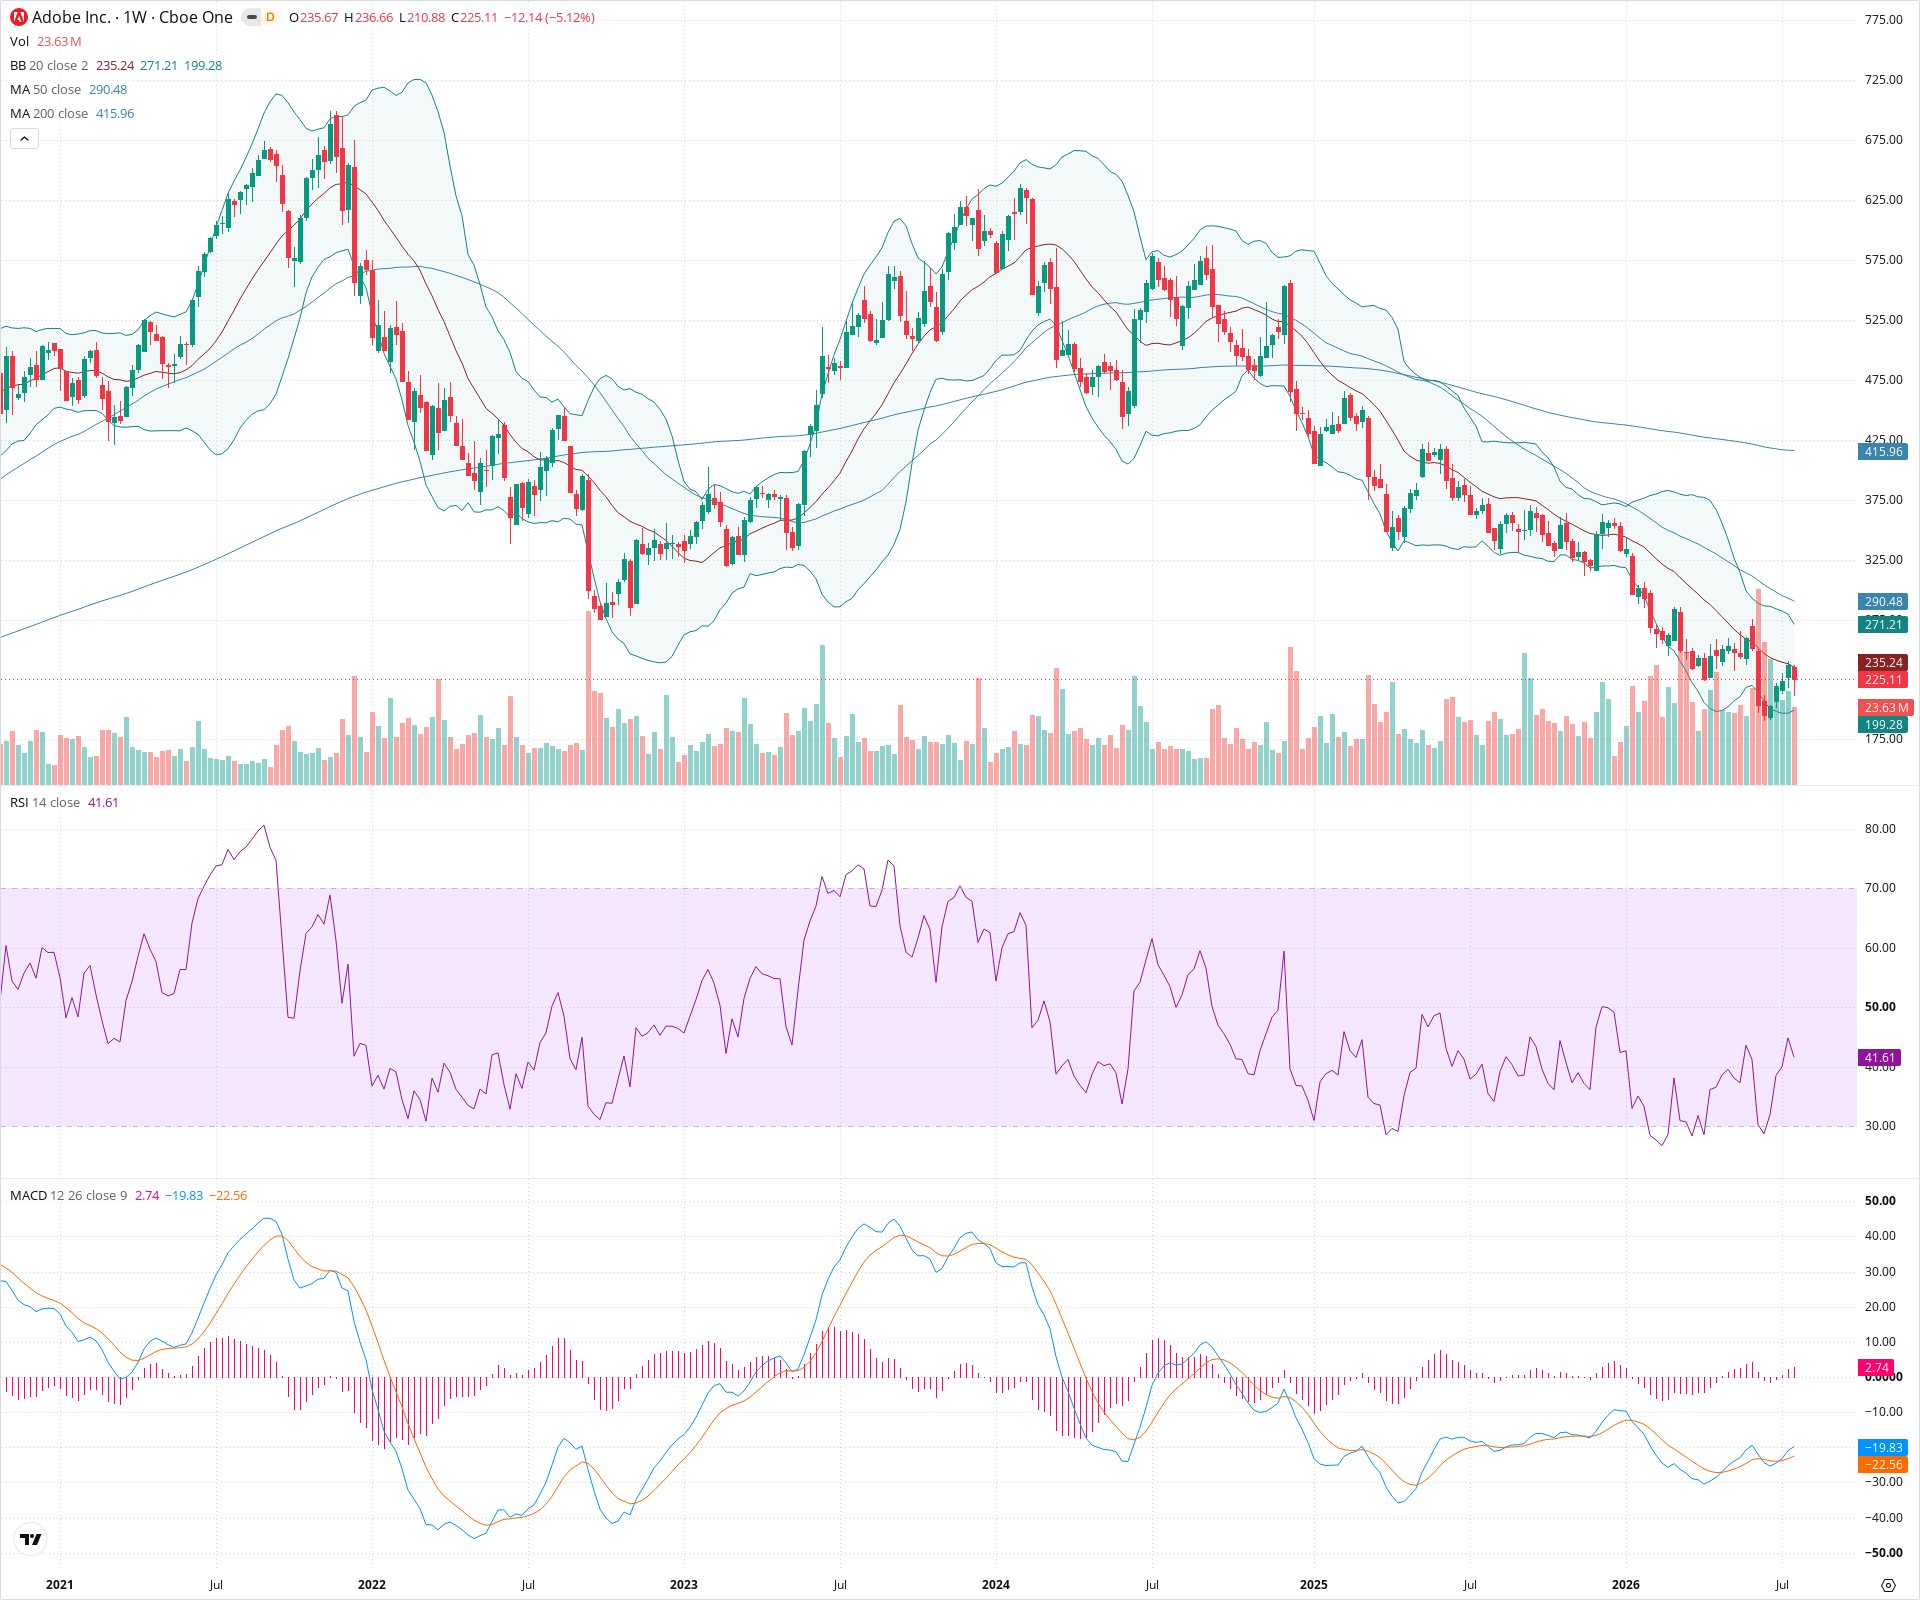
The weekly chart depicts a firmly established, long-term bearish trend. Price action remains suppressed by all major moving averages, with recent rallies being aggressively sold at the 20-week and 50-week SMAs. Although the MACD shows a recent crossover in deep negative territory, the lack of price follow-through suggests weak buying interest, keeping the dominant path of least resistance to the downside.
Included In Lists
Related Tickers of Interest
ADBE Weekly Chart
Sentiment
Short-term Sentiment (days to weeks): Bearish
Price recently rejected at the 20-week SMA and is closing near the bottom of its recent range, with RSI remaining in bearish territory below 50.
Long-term Sentiment (weeks to months): Bearish
The stock is in a severe multi-year downtrend, characterized by a series of lower highs and lower lows, and remains trading significantly below downward-sloping 50-week and 200-week SMAs.
Report Metadata
- Timeframe: weekly
- Generated at: 2026-07-25T09:04:59.198Z
- Model: gemini-3.1-pro-preview
Support Price Levels
| Level | Range | Strength | Notes |
|---|---|---|---|
| $207.50 | $200.00 - $215.00 | Weak | Recent swing low established by the current and previous candlestick wicks. Psychological support at 200. |
Resistance Price Levels
| Level | Range | Strength | Notes |
|---|---|---|---|
| $282.50 | $270.00 - $295.00 | Strong | Recent lower high and the descending 50-week SMA (290.48). |
| $330.00 | $320.00 - $340.00 | Strong | Prior major consolidation zone that acted as support before breaking down; now serves as heavy overhead resistance. |
| $410.00 | $400.00 - $420.00 | Strong | Major structural resistance zone aligning with the declining 200-week SMA (415.96). |
Potential Chart Patterns in Formation
| Strength | Pattern | Signal | Target | Details |
|---|---|---|---|---|
| Strong | Secular Downtrend | Bearish | N/A | A persistent sequence of lower highs and lower lows heavily contained by the 20-week and 50-week moving averages. |
Frequently Asked Questions about ADBE
What is the current sentiment for ADBE?
The short-term sentiment for ADBE is currently Bearish because Price recently rejected at the 20-week SMA and is closing near the bottom of its recent range, with RSI remaining in bearish territory below 50.. The long-term trend is classified as Bearish.
What are the key support levels for ADBE?
StockDips.AI has identified key support levels for ADBE at $207.50. These levels may represent potential accumulation zones where buying interest could emerge.
Is ADBE in a significant dip or a Value Dip right now?
ADBE has a Value Score of 43/100. It is not currently flagged as a significant dip in the Top Dips list. It is not listed as a Value Dip because the long-term sentiment or value-score threshold does not qualify.
View the full interactive analysis on StockDips.AI.