ADBE Monthly Technical Analysis
Adobe Inc.
Developer of creative and digital media software including Photoshop, Illustrator, Premiere, and Acrobat. A leader in cloud-based creative software and digital marketing platforms.
ADBE Technical Analysis Summary
Adobe is undergoing a severe correction within a macro consolidation pattern, confirmed by a massive monthly engulfing candle and a failure to set new highs. The loss of the 50-month SMA and bearish momentum indicators point toward a retest of the critical 2022 lows and potentially the 200-month SMA, marking a decisive stress test for the long-term secular trend.
Included In Lists
Related Tickers of Interest
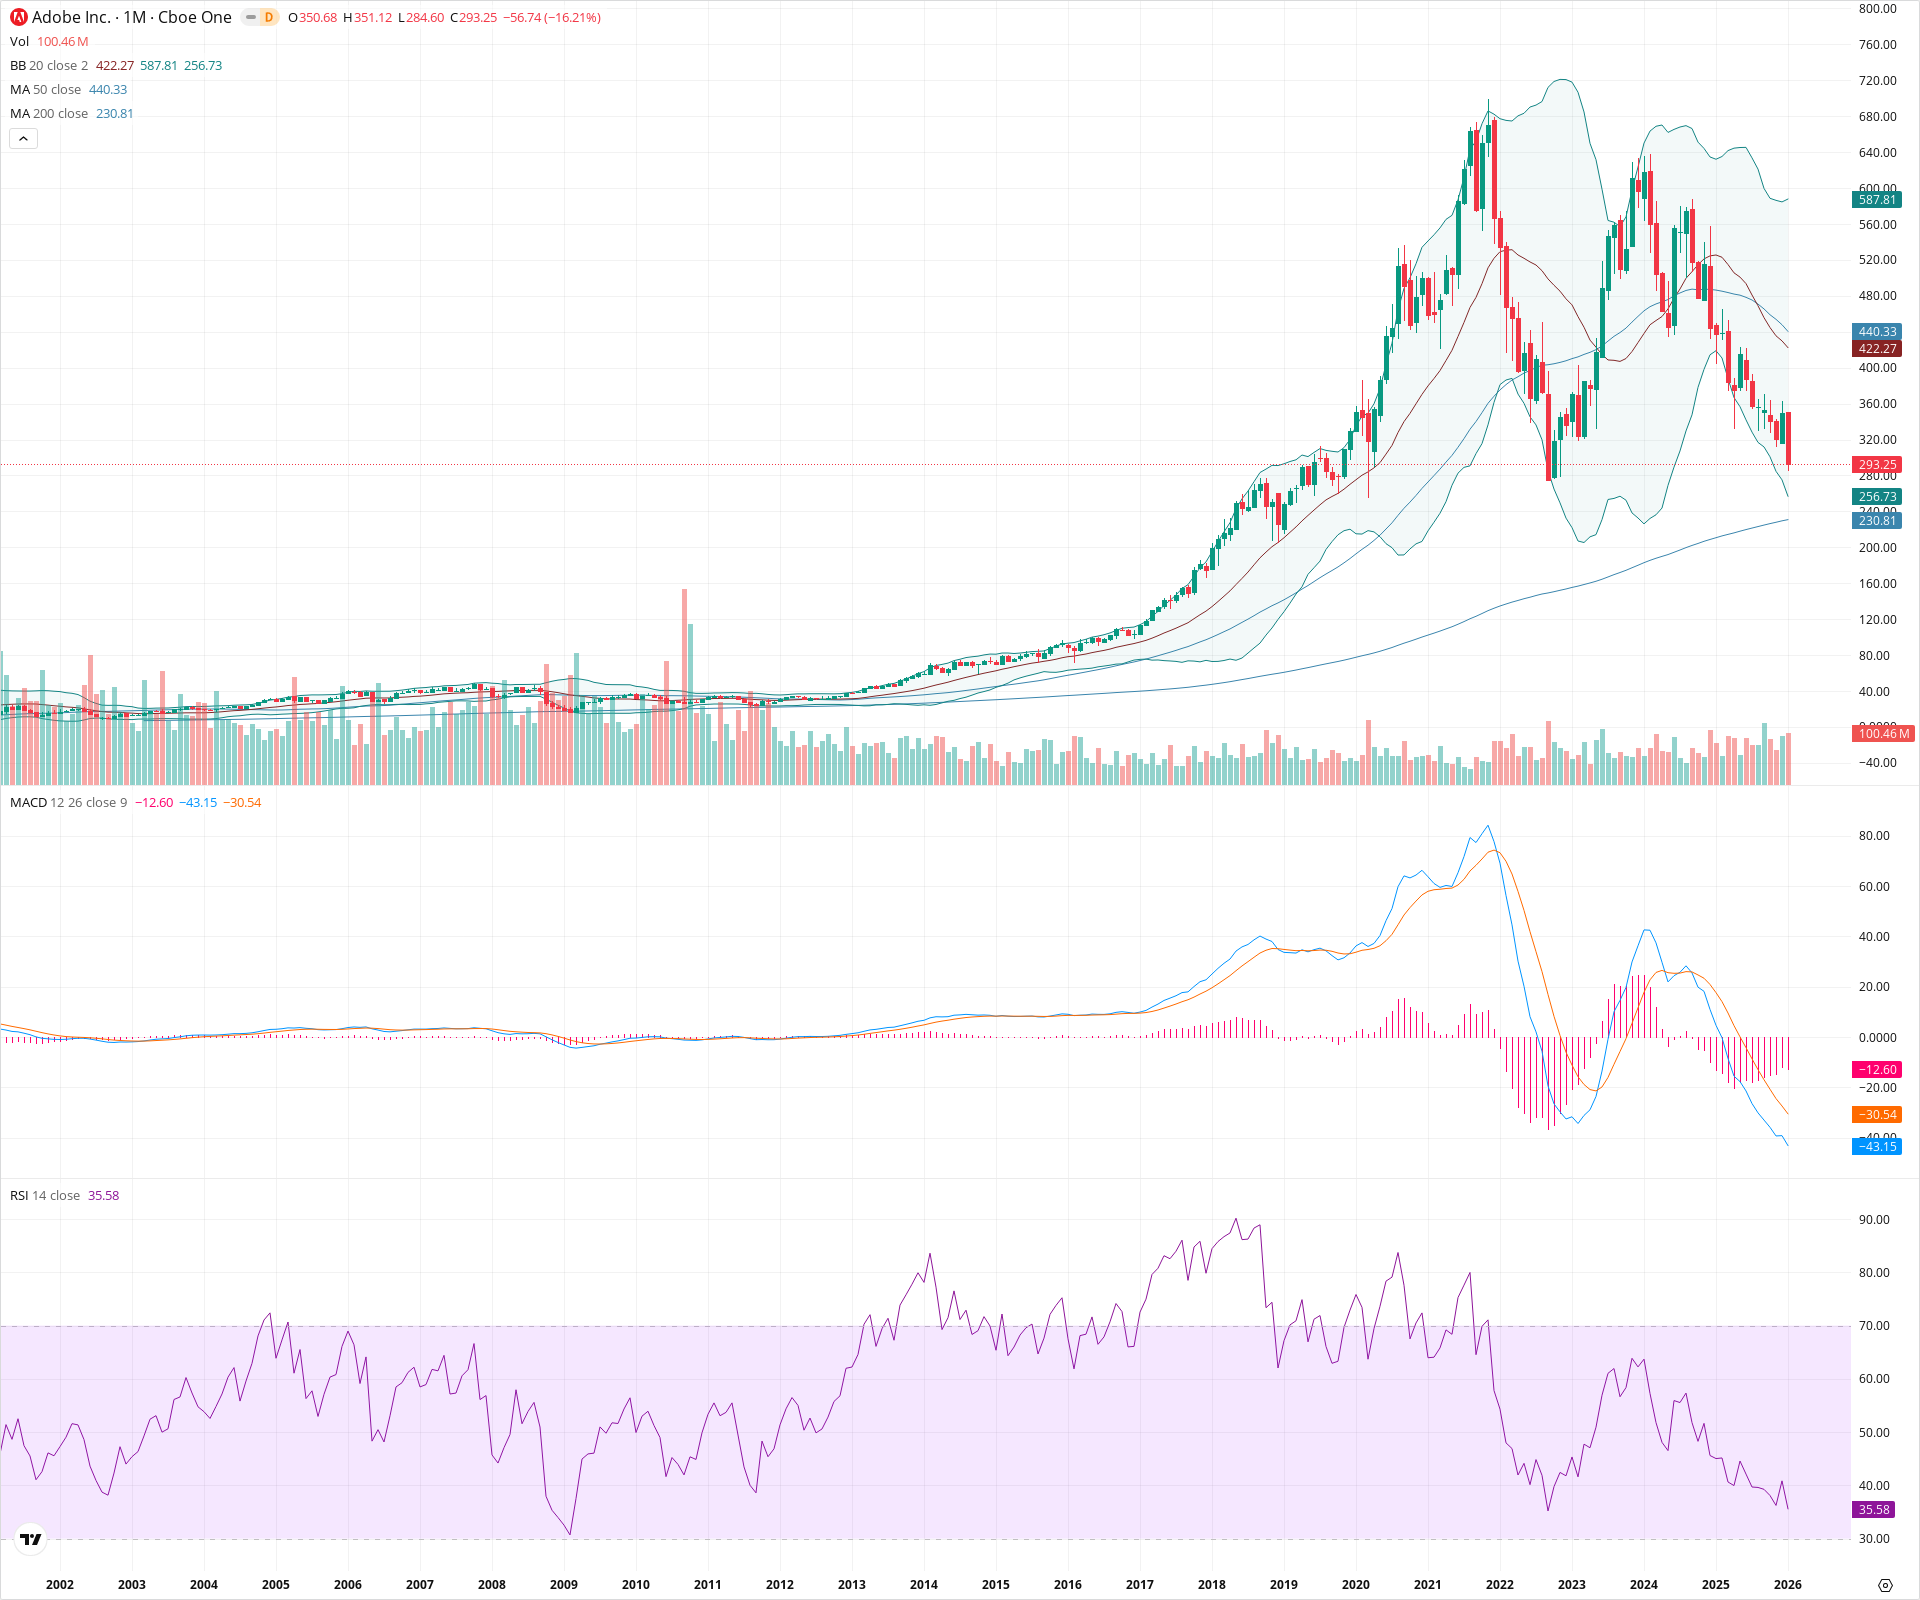
ADBE Monthly Chart
Sentiment
Short-term Sentiment (days to weeks): Bearish
Price is in a steep monthly decline (-16.21%), breaking recent consolidation zones. Momentum is strongly negative with RSI dropping near oversold territory (35.58) and MACD histogram expanding downwards.
Long-term Sentiment (weeks to months): Bearish
The chart displays a macro lower high structure relative to the 2021 peak, signaling a potential secular trend reversal. Price has lost the 20-month and 50-month SMAs, placing the long-term bull regime in jeopardy.
Report Metadata
- Timeframe: monthly
- Generated at: 2026-02-02T05:10:44.514Z
- Model: gemini-3-pro-preview
Support Price Levels
| Level | Range | Strength | Notes |
|---|---|---|---|
| $280.00 | $275.00 - $285.00 | Strong | Major structural support zone established by the 2022 bear market lows. |
| $243.77 | $230.81 - $256.73 | Strong | Confluence of the secular 200-month SMA (230.81) and the monthly Bollinger Band lower limit (256.73). |
Resistance Price Levels
| Level | Range | Strength | Notes |
|---|---|---|---|
| $431.30 | $422.27 - $440.33 | Strong | Heavy dynamic resistance formed by the breakdown of the 20-month and 50-month SMAs. |
| $620.00 | $600.00 - $640.00 | Strong | The recent cyclical peak which formed a lower high compared to the all-time high. |
Potential Chart Patterns in Formation
| Strength | Pattern | Signal | Target | Details |
|---|---|---|---|---|
| Strong | Macro Lower High / Potential Double Top | Bearish | $230.00 | After recovering from 2022 lows, price failed to reach the 2021 highs, peaking near 640 and rolling over. This suggests a large-scale distribution pattern. |
Frequently Asked Questions about ADBE
What is the current sentiment for ADBE?
The short-term sentiment for ADBE is currently Bearish because Price is in a steep monthly decline (-16.21%), breaking recent consolidation zones. Momentum is strongly negative with RSI dropping near oversold territory (35.58) and MACD histogram expanding downwards.. The long-term trend is classified as Bearish.
What are the key support levels for ADBE?
StockDips.AI has identified key support levels for ADBE at $280.00 and $243.77. These levels may represent potential accumulation zones where buying interest could emerge.
Is ADBE in a significant dip or a Value Dip right now?
ADBE has a Value Score of 43/100. It is not currently flagged as a significant dip in the Top Dips list. It is not listed as a Value Dip because the long-term sentiment or value-score threshold does not qualify.
View the full interactive analysis on StockDips.AI.