TSLA Daily Technical Analysis
Tesla Inc
Electric vehicle and clean energy company known for innovation and global EV leadership.
TSLA Technical Analysis Summary
The technical posture for TSLA is strongly bearish across both short and long-term timeframes. The chart shows a major distribution phase culminating in a breakdown below key support near 380, accompanied by a Death Cross of the moving averages. While the RSI is heavily oversold and could prompt short-term relief bounces, the prevailing momentum heavily favors downside continuation toward foundational support levels.
Included In Lists
Related Tickers of Interest
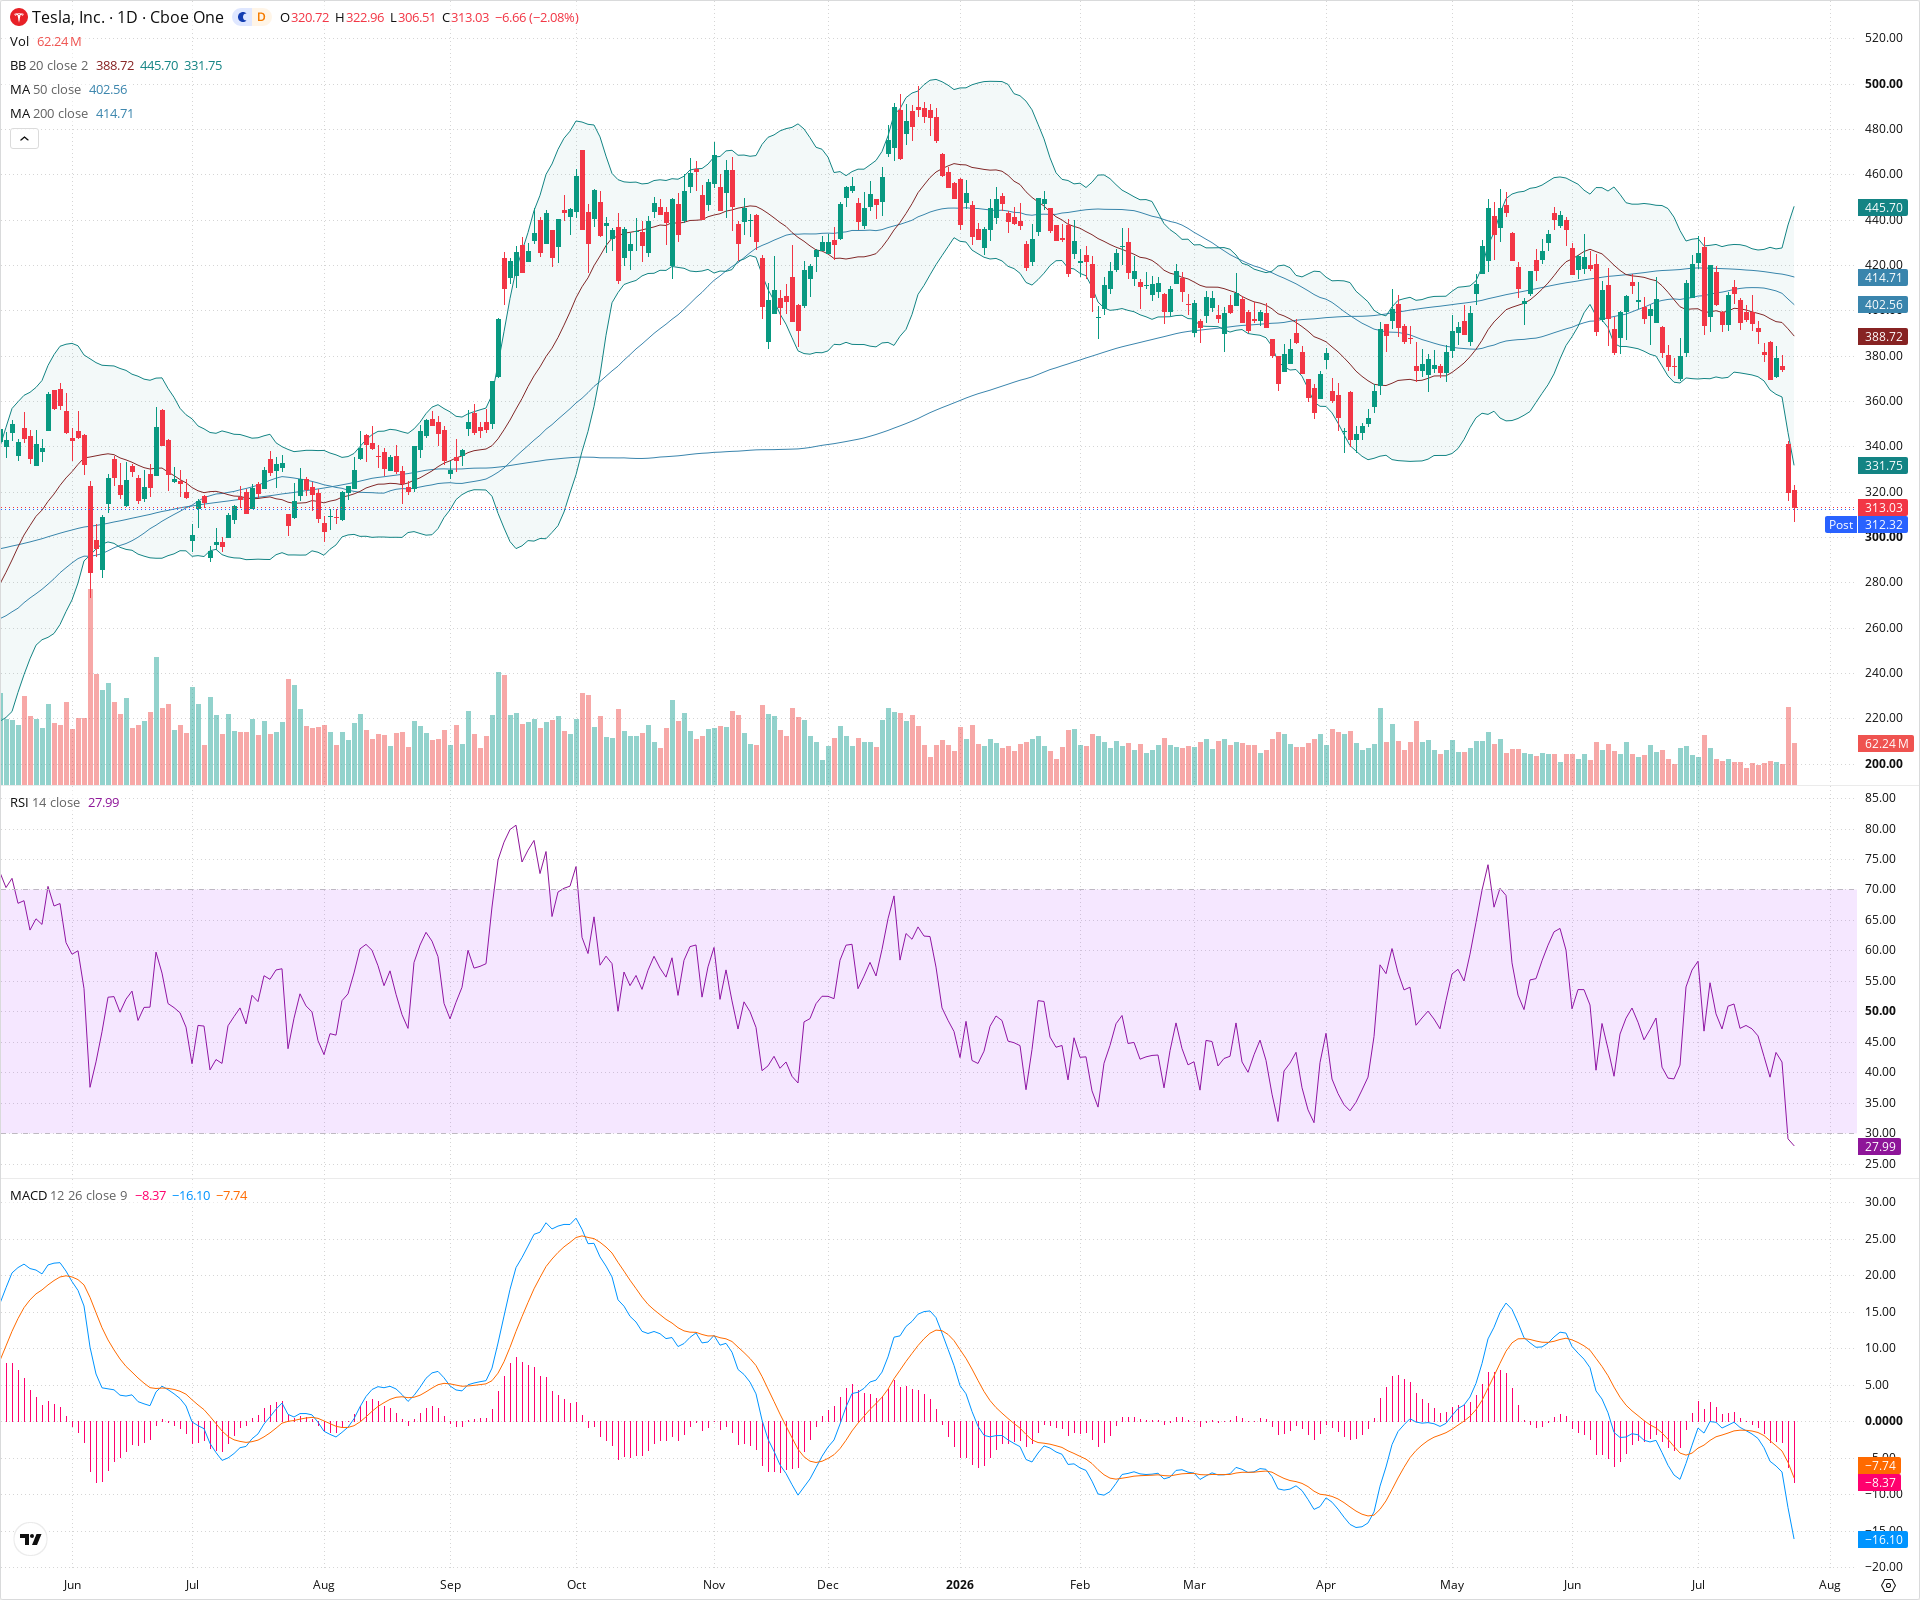
TSLA Daily Chart
Sentiment
Short-term Sentiment (days to weeks): Bearish
Price is experiencing a sharp breakdown, piercing the lower Bollinger Band with expanding volume. MACD shows accelerating negative momentum, and the RSI is deeply oversold at 27.99, indicating strong selling pressure despite potential for short-term mean reversion.
Long-term Sentiment (weeks to months): Bearish
The 50-day SMA has crossed below the 200-day SMA (Death Cross), and price is trending well below both moving averages. A large, multi-month topping structure has broken down, establishing a clear sequence of lower highs and lower lows.
Report Metadata
- Timeframe: daily
- Generated at: 2026-07-24T21:03:08.099Z
- Model: gemini-3.1-pro-preview
Support Price Levels
| Level | Range | Strength | Notes |
|---|---|---|---|
| $302.50 | $295.00 - $310.00 | Weak | Immediate psychological support at 300, aligning with minor consolidation from early in the chart's visible uptrend. |
| $270.00 | $260.00 - $280.00 | Strong | Major prior consolidation base from the far left of the chart, before the significant run-up began. |
Resistance Price Levels
| Level | Range | Strength | Notes |
|---|---|---|---|
| $342.50 | $335.00 - $350.00 | Strong | Recent breakdown level and near the lower Bollinger Band, which will now act as immediate overhead supply. |
| $392.50 | $380.00 - $405.00 | Strong | Major previous support zone (neckline of the broad topping structure) that has turned into heavy resistance, reinforced by the declining 50-day SMA. |
Potential Chart Patterns in Formation
| Strength | Pattern | Signal | Target | Details |
|---|---|---|---|---|
| Strong | Death Cross | Bearish | N/A | The 50-day SMA has crossed below the 200-day SMA, confirming a shift in long-term momentum to the downside. |
| Strong | Topping Structure Breakdown | Bearish | N/A | A massive, complex topping formation established over several months has broken below its primary support zone around 380, initiating a new leg lower. |
Frequently Asked Questions about TSLA
What is the current sentiment for TSLA?
The short-term sentiment for TSLA is currently Bearish because Price is experiencing a sharp breakdown, piercing the lower Bollinger Band with expanding volume. MACD shows accelerating negative momentum, and the RSI is deeply oversold at 27.99, indicating strong selling pressure despite potential for short-term mean reversion.. The long-term trend is classified as Bearish.
What are the key support levels for TSLA?
StockDips.AI has identified key support levels for TSLA at $302.50 and $270.00. These levels may represent potential accumulation zones where buying interest could emerge.
Is TSLA in a significant dip or a Value Dip right now?
TSLA has a Value Score of 74/100. It is currently flagged as a significant dip in the Top Dips list. It is not listed as a Value Dip because the long-term sentiment or value-score threshold does not qualify.
View the full interactive analysis on StockDips.AI.