BABA Daily Technical Analysis
Alibaba Group
One of China’s largest technology companies, operating e-commerce (Taobao, Tmall), cloud computing (Alibaba Cloud), logistics, and digital payments (Alipay ecosystem).
BABA Technical Analysis Summary
BABA remains entrenched in a long-term downtrend, characterized by a declining 200-day SMA and lower highs. While a recent relief rally from the $90 area brought some short-term stability, momentum has stalled upon testing the 50-day SMA. The stock is currently in a neutral consolidation phase; a breakout above the 50-day SMA could signal further recovery, whereas a breakdown below the 20-day SMA would likely trigger a retest of the major $90 support zone.
Included In Lists
Related Tickers of Interest
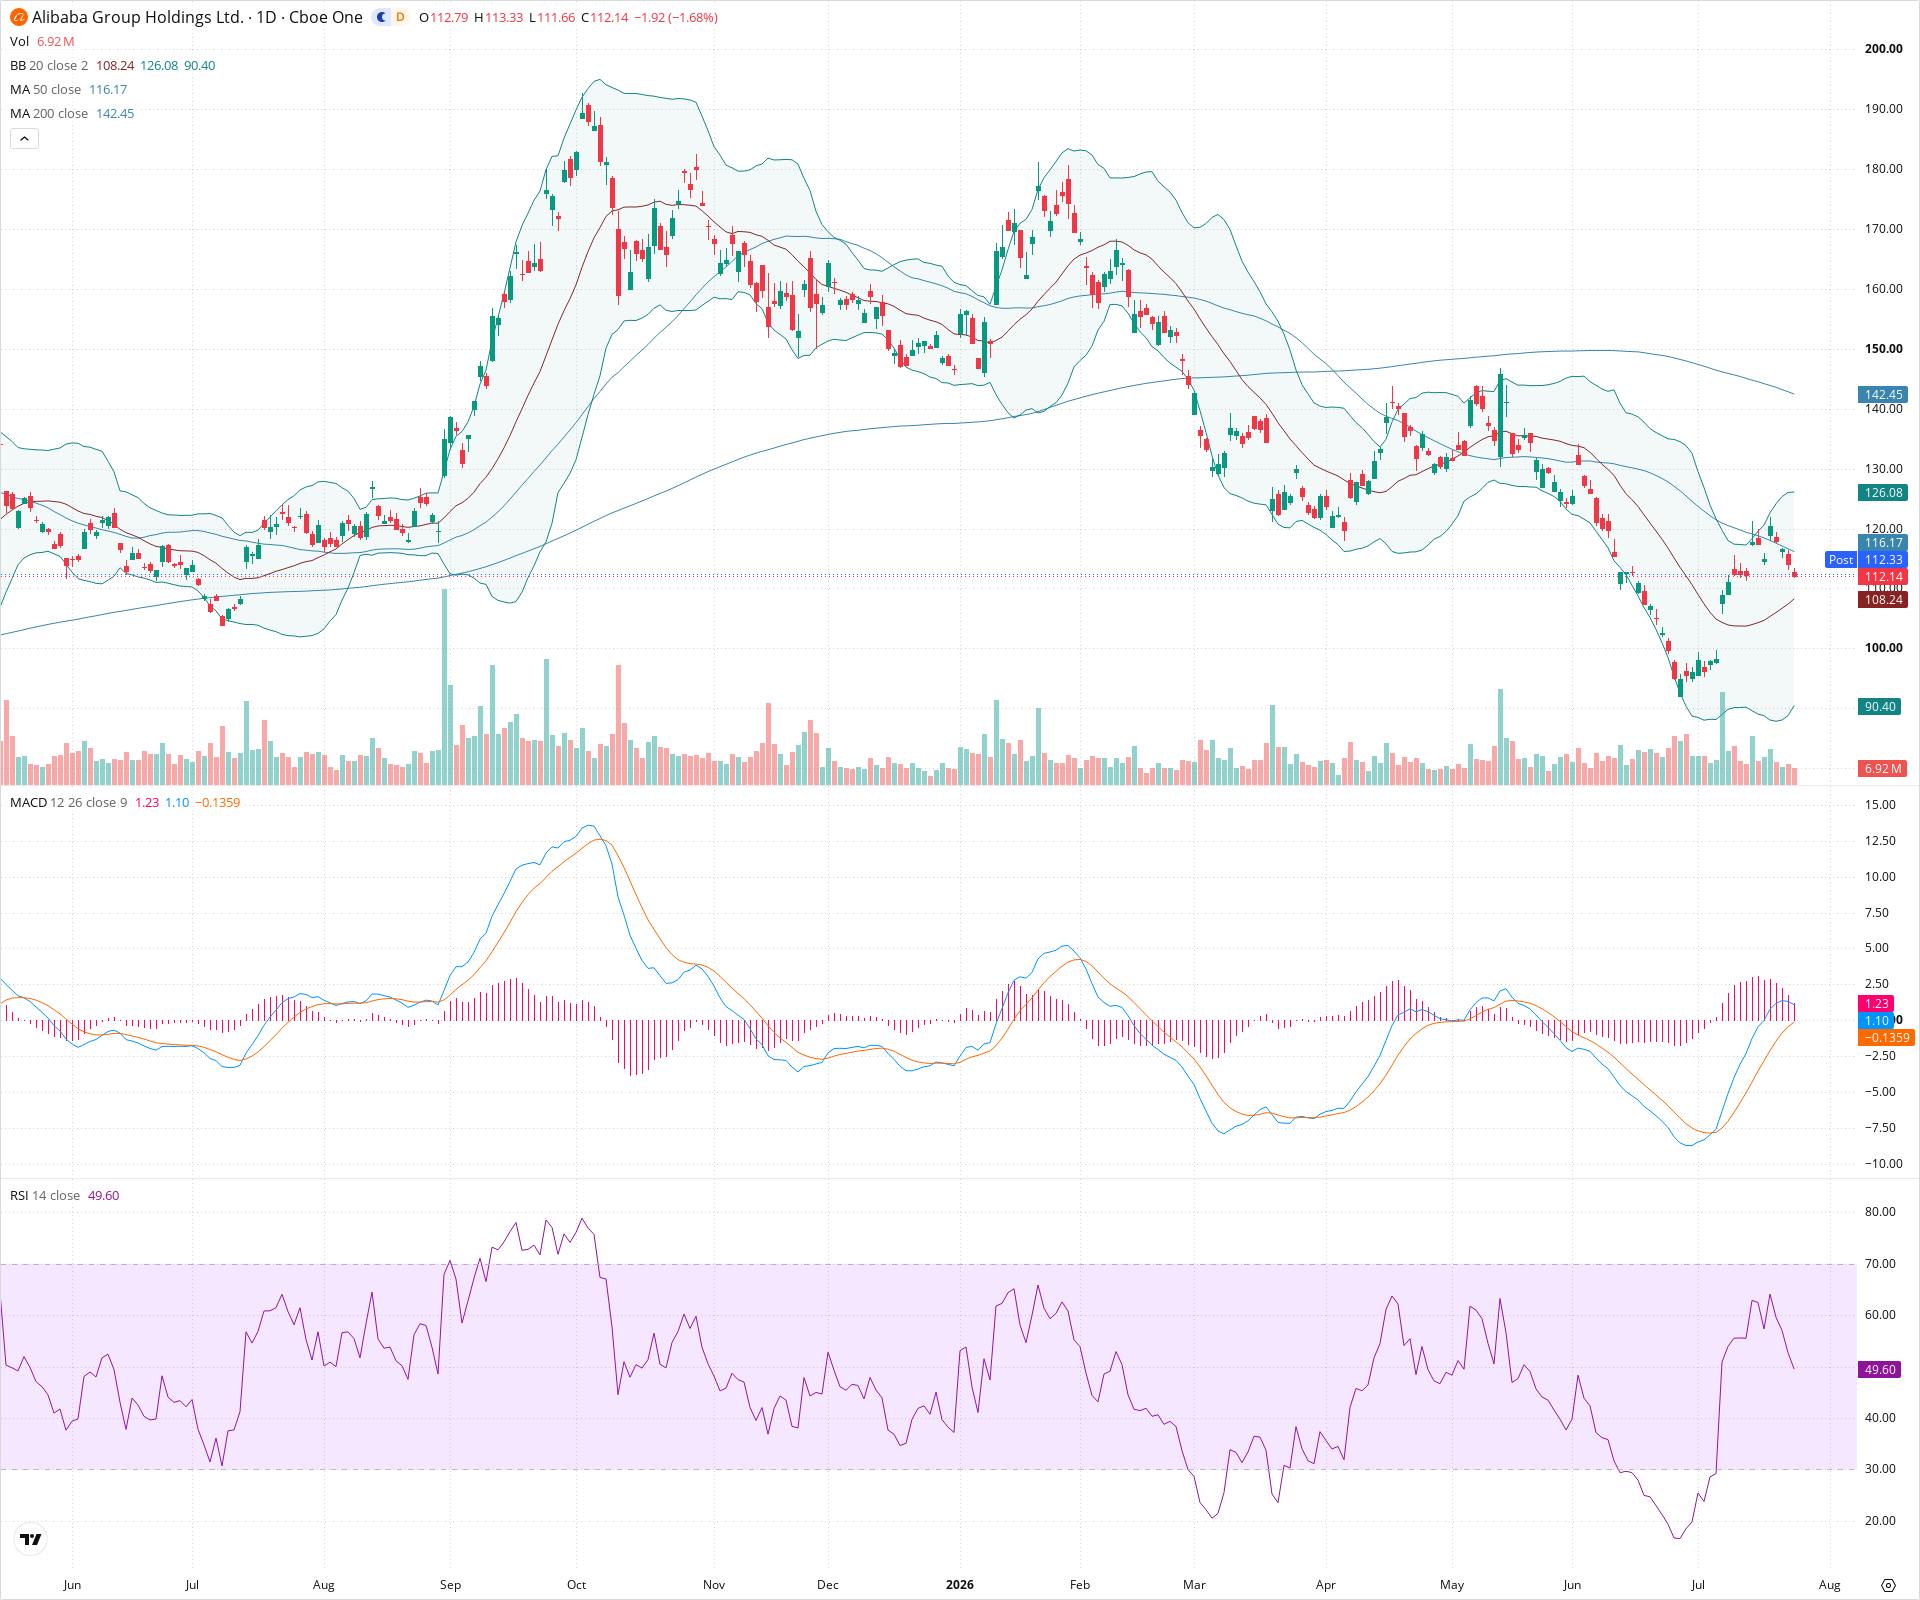
BABA Daily Chart
Sentiment
Short-term Sentiment (days to weeks): Neutral
Price is currently consolidating in a tight range, trapped between the rising 20-day SMA as support and the declining 50-day SMA as resistance. The RSI is hovering near 50, and the MACD shows decreasing momentum, indicating a lack of clear short-term direction.
Long-term Sentiment (weeks to months): Bearish
The long-term trend remains firmly down, evidenced by the price trading significantly below a declining 200-day SMA. Additionally, the 50-day SMA is positioned below the 200-day SMA, reinforcing the broader bearish market structure.
Report Metadata
- Timeframe: daily
- Generated at: 2026-07-24T21:11:28.099Z
- Model: gemini-3.1-pro-preview
Support Price Levels
| Level | Range | Strength | Notes |
|---|---|---|---|
| $106.75 | $105.00 - $108.50 | Strong | Near-term support zone aligning with the 20-day SMA and recent consolidation lows. |
| $90.00 | $88.00 - $92.00 | Strong | Major structural swing low and double bottom area established in the summer months. |
Resistance Price Levels
| Level | Range | Strength | Notes |
|---|---|---|---|
| $118.00 | $116.00 - $120.00 | Strong | Immediate resistance formed by the 50-day SMA and the peak of the recent counter-trend rally. |
| $142.50 | $140.00 - $145.00 | Strong | Significant overhead resistance zone coinciding with prior consolidation structures and the descending 200-day SMA. |
Potential Chart Patterns in Formation
| Strength | Pattern | Signal | Target | Details |
|---|---|---|---|---|
| Strong | Moving Average Rejection | Bearish | N/A | Price rallied into the 50-day SMA but failed to break through, forming a lower high relative to previous market structures. This reinforces the prevailing downtrend. |
Frequently Asked Questions about BABA
What is the current sentiment for BABA?
The short-term sentiment for BABA is currently Neutral because Price is currently consolidating in a tight range, trapped between the rising 20-day SMA as support and the declining 50-day SMA as resistance. The RSI is hovering near 50, and the MACD shows decreasing momentum, indicating a lack of clear short-term direction.. The long-term trend is classified as Bearish.
What are the key support levels for BABA?
StockDips.AI has identified key support levels for BABA at $106.75 and $90.00. These levels may represent potential accumulation zones where buying interest could emerge.
Is BABA in a significant dip or a Value Dip right now?
BABA has a Value Score of 52/100. It is not currently flagged as a significant dip in the Top Dips list. It is not listed as a Value Dip because the long-term sentiment or value-score threshold does not qualify.
View the full interactive analysis on StockDips.AI.