BABA Monthly Technical Analysis
Alibaba Group
One of China’s largest technology companies, operating e-commerce (Taobao, Tmall), cloud computing (Alibaba Cloud), logistics, and digital payments (Alipay ecosystem).
BABA Technical Analysis Summary
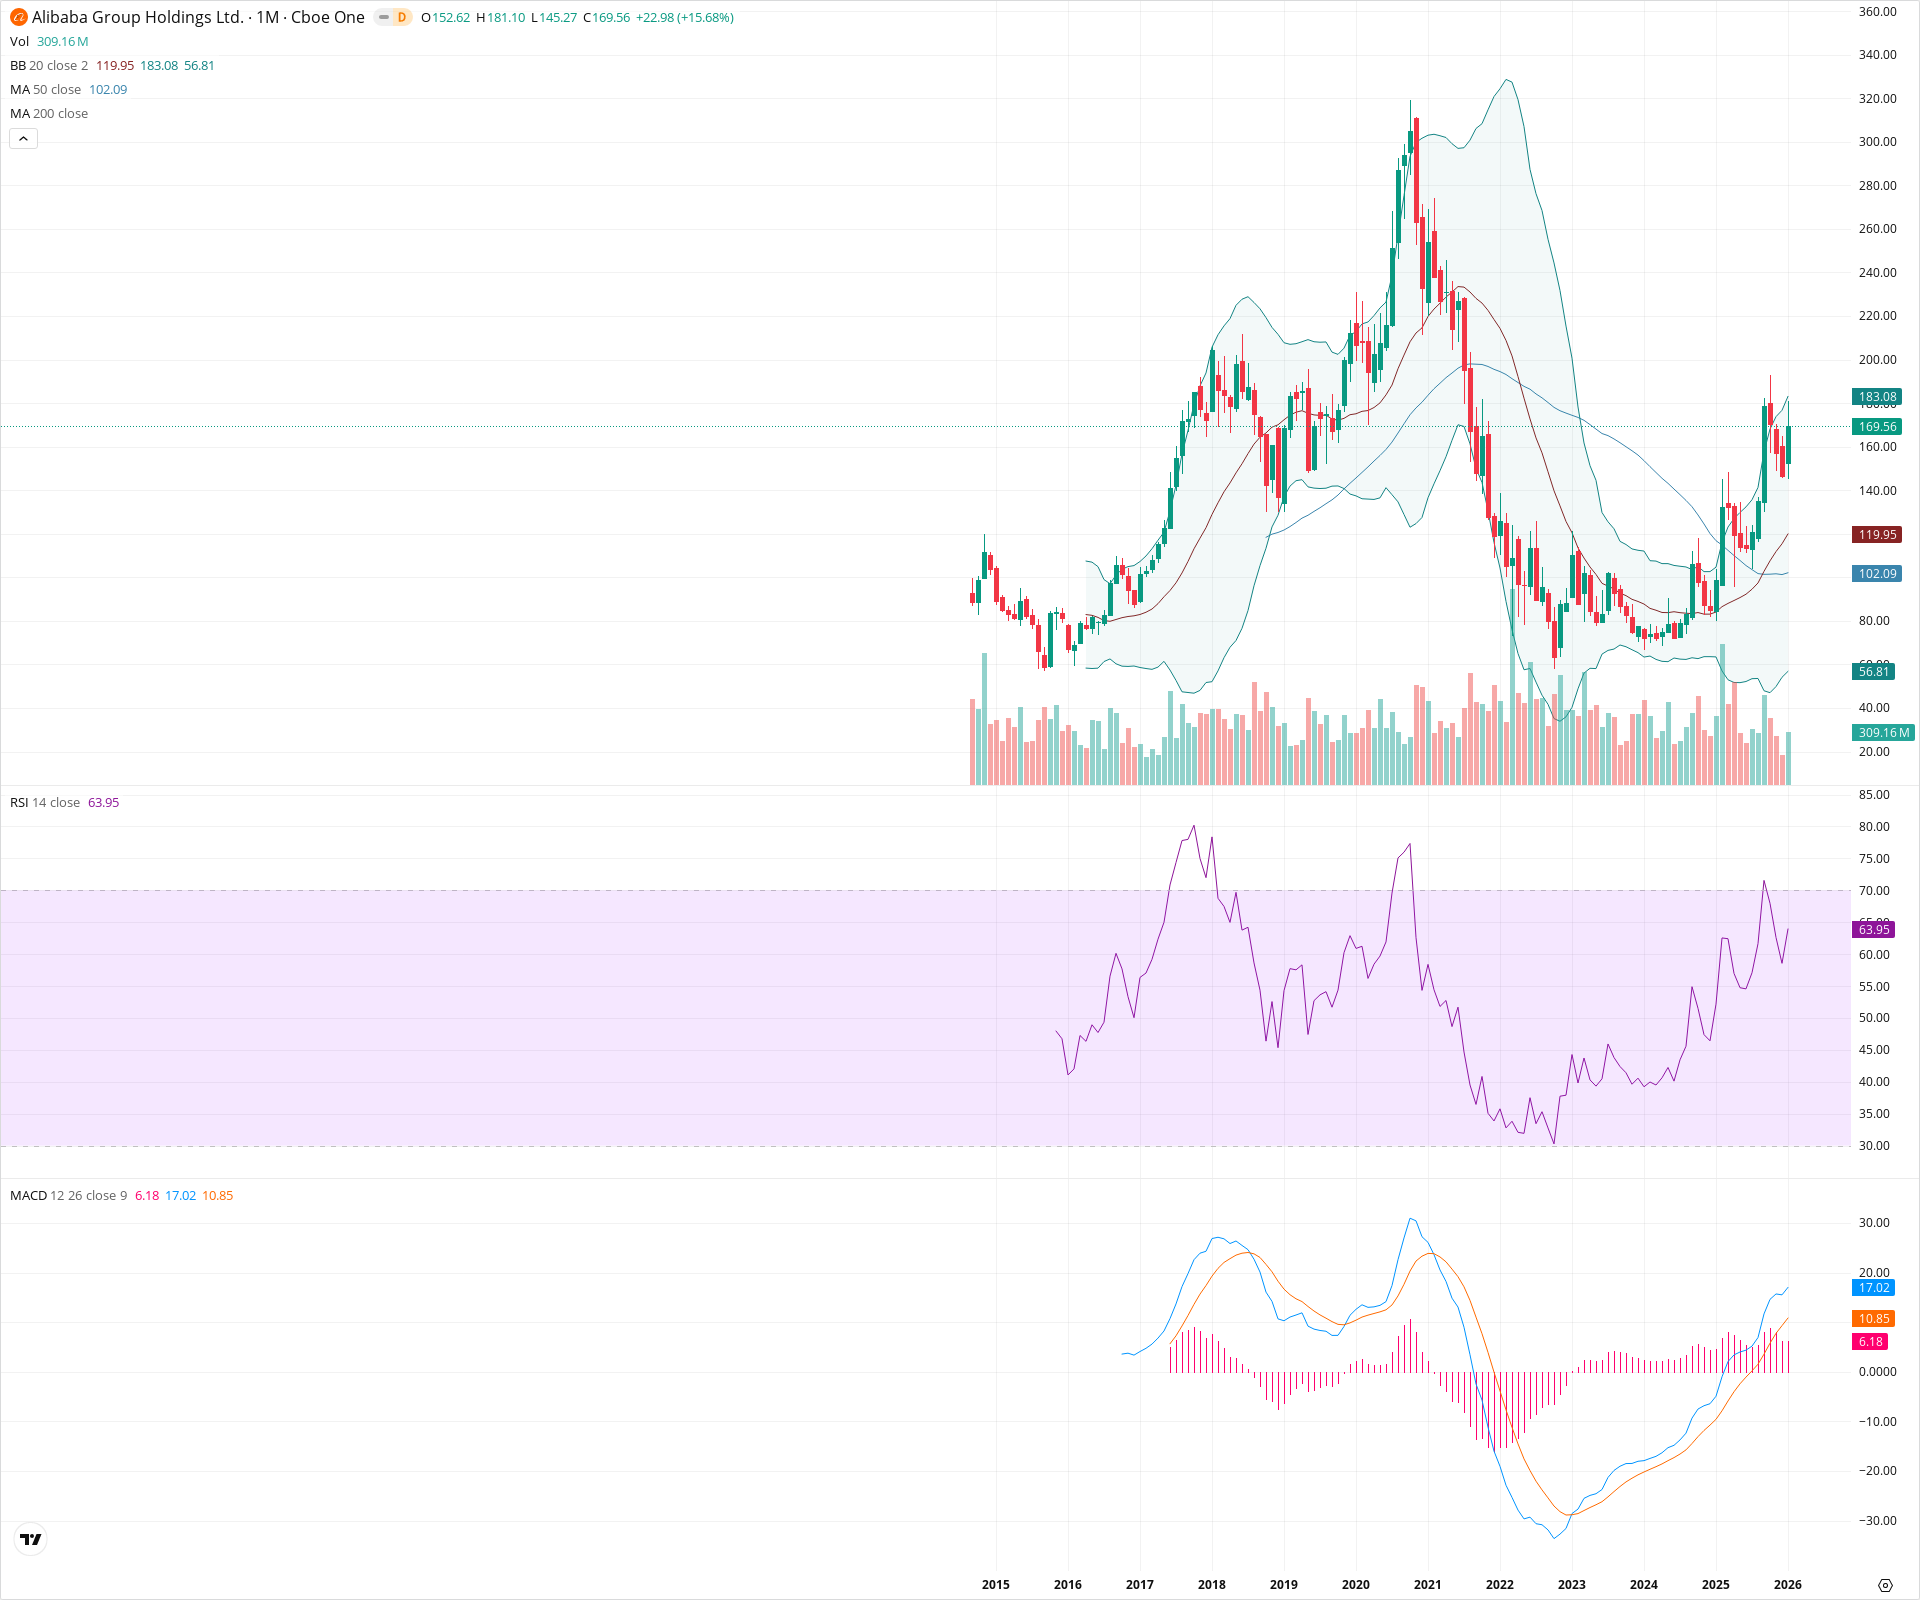
BABA has confirmed a secular trend reversal by breaking out of a 3-year rounding bottom structure and reclaiming key moving averages. The Monthly MACD crossing above the zero line signals a shift to a bullish long-term regime, supported by rising volume and RSI metrics. While the price is approaching the upper Bollinger Band resistance near 183, the structural momentum suggests a drift toward the 200-210 historical resistance zone over the longer term.
Included In Lists
Related Tickers of Interest
BABA Monthly Chart
Sentiment
Short-term Sentiment (days to weeks): Bullish
The current monthly candle is strong and green (+15.68%), trading well above the 20-month SMA and approaching the upper Bollinger Band. RSI is rising (63.95) indicating momentum without being extremely overbought.
Long-term Sentiment (weeks to months): Bullish
Price has successfully broken out of a multi-year base (2022-2024). The MACD has crossed above the zero line (17.02), confirming a major secular regime change from bearish/neutral to bullish. Price is sustaining levels above the 50-month SMA.
Report Metadata
- Timeframe: monthly
- Generated at: 2026-02-02T05:31:52.838Z
- Model: gemini-3-pro-preview
Support Price Levels
| Level | Range | Strength | Notes |
|---|---|---|---|
| $117.50 | $115.00 - $120.00 | Strong | Confluence of the 20-month SMA (Bollinger Basis) and previous consolidation resistance turned support. |
| $102.50 | $100.00 - $105.00 | Strong | 50-month SMA acting as dynamic support. |
| $66.50 | $58.00 - $75.00 | Strong | Major multi-year secular bottom/base structure. |
Resistance Price Levels
| Level | Range | Strength | Notes |
|---|---|---|---|
| $181.54 | $180.00 - $183.08 | Weak | Upper Bollinger Band level; currently being tested. |
| $206.00 | $200.00 - $212.00 | Strong | Historical swing highs from 2018 and psychological round number. |
| $310.00 | $300.00 - $320.00 | Strong | All-time high zone from 2020. |
Potential Chart Patterns in Formation
| Strength | Pattern | Signal | Target | Details |
|---|---|---|---|---|
| Strong | Rounding Bottom | Bullish | $210.00 | A multi-year saucer formation from 2022 to present, indicating long-term accumulation and trend reversal. |
Frequently Asked Questions about BABA
What is the current sentiment for BABA?
The short-term sentiment for BABA is currently Bullish because The current monthly candle is strong and green (+15.68%), trading well above the 20-month SMA and approaching the upper Bollinger Band. RSI is rising (63.95) indicating momentum without being extremely overbought.. The long-term trend is classified as Bullish.
What are the key support levels for BABA?
StockDips.AI has identified key support levels for BABA at $117.50 and $102.50. These levels may represent potential accumulation zones where buying interest could emerge.
Is BABA in a significant dip or a Value Dip right now?
BABA has a Value Score of 52/100. It is not currently flagged as a significant dip in the Top Dips list. It is not listed as a Value Dip because the long-term sentiment or value-score threshold does not qualify.
View the full interactive analysis on StockDips.AI.