BHVN Monthly Technical Analysis
Biohaven Ltd
Biopharmaceutical company focused on discovering, developing, and commercializing treatments for diseases in neuroscience, immunology, and oncology
BHVN Technical Analysis Summary
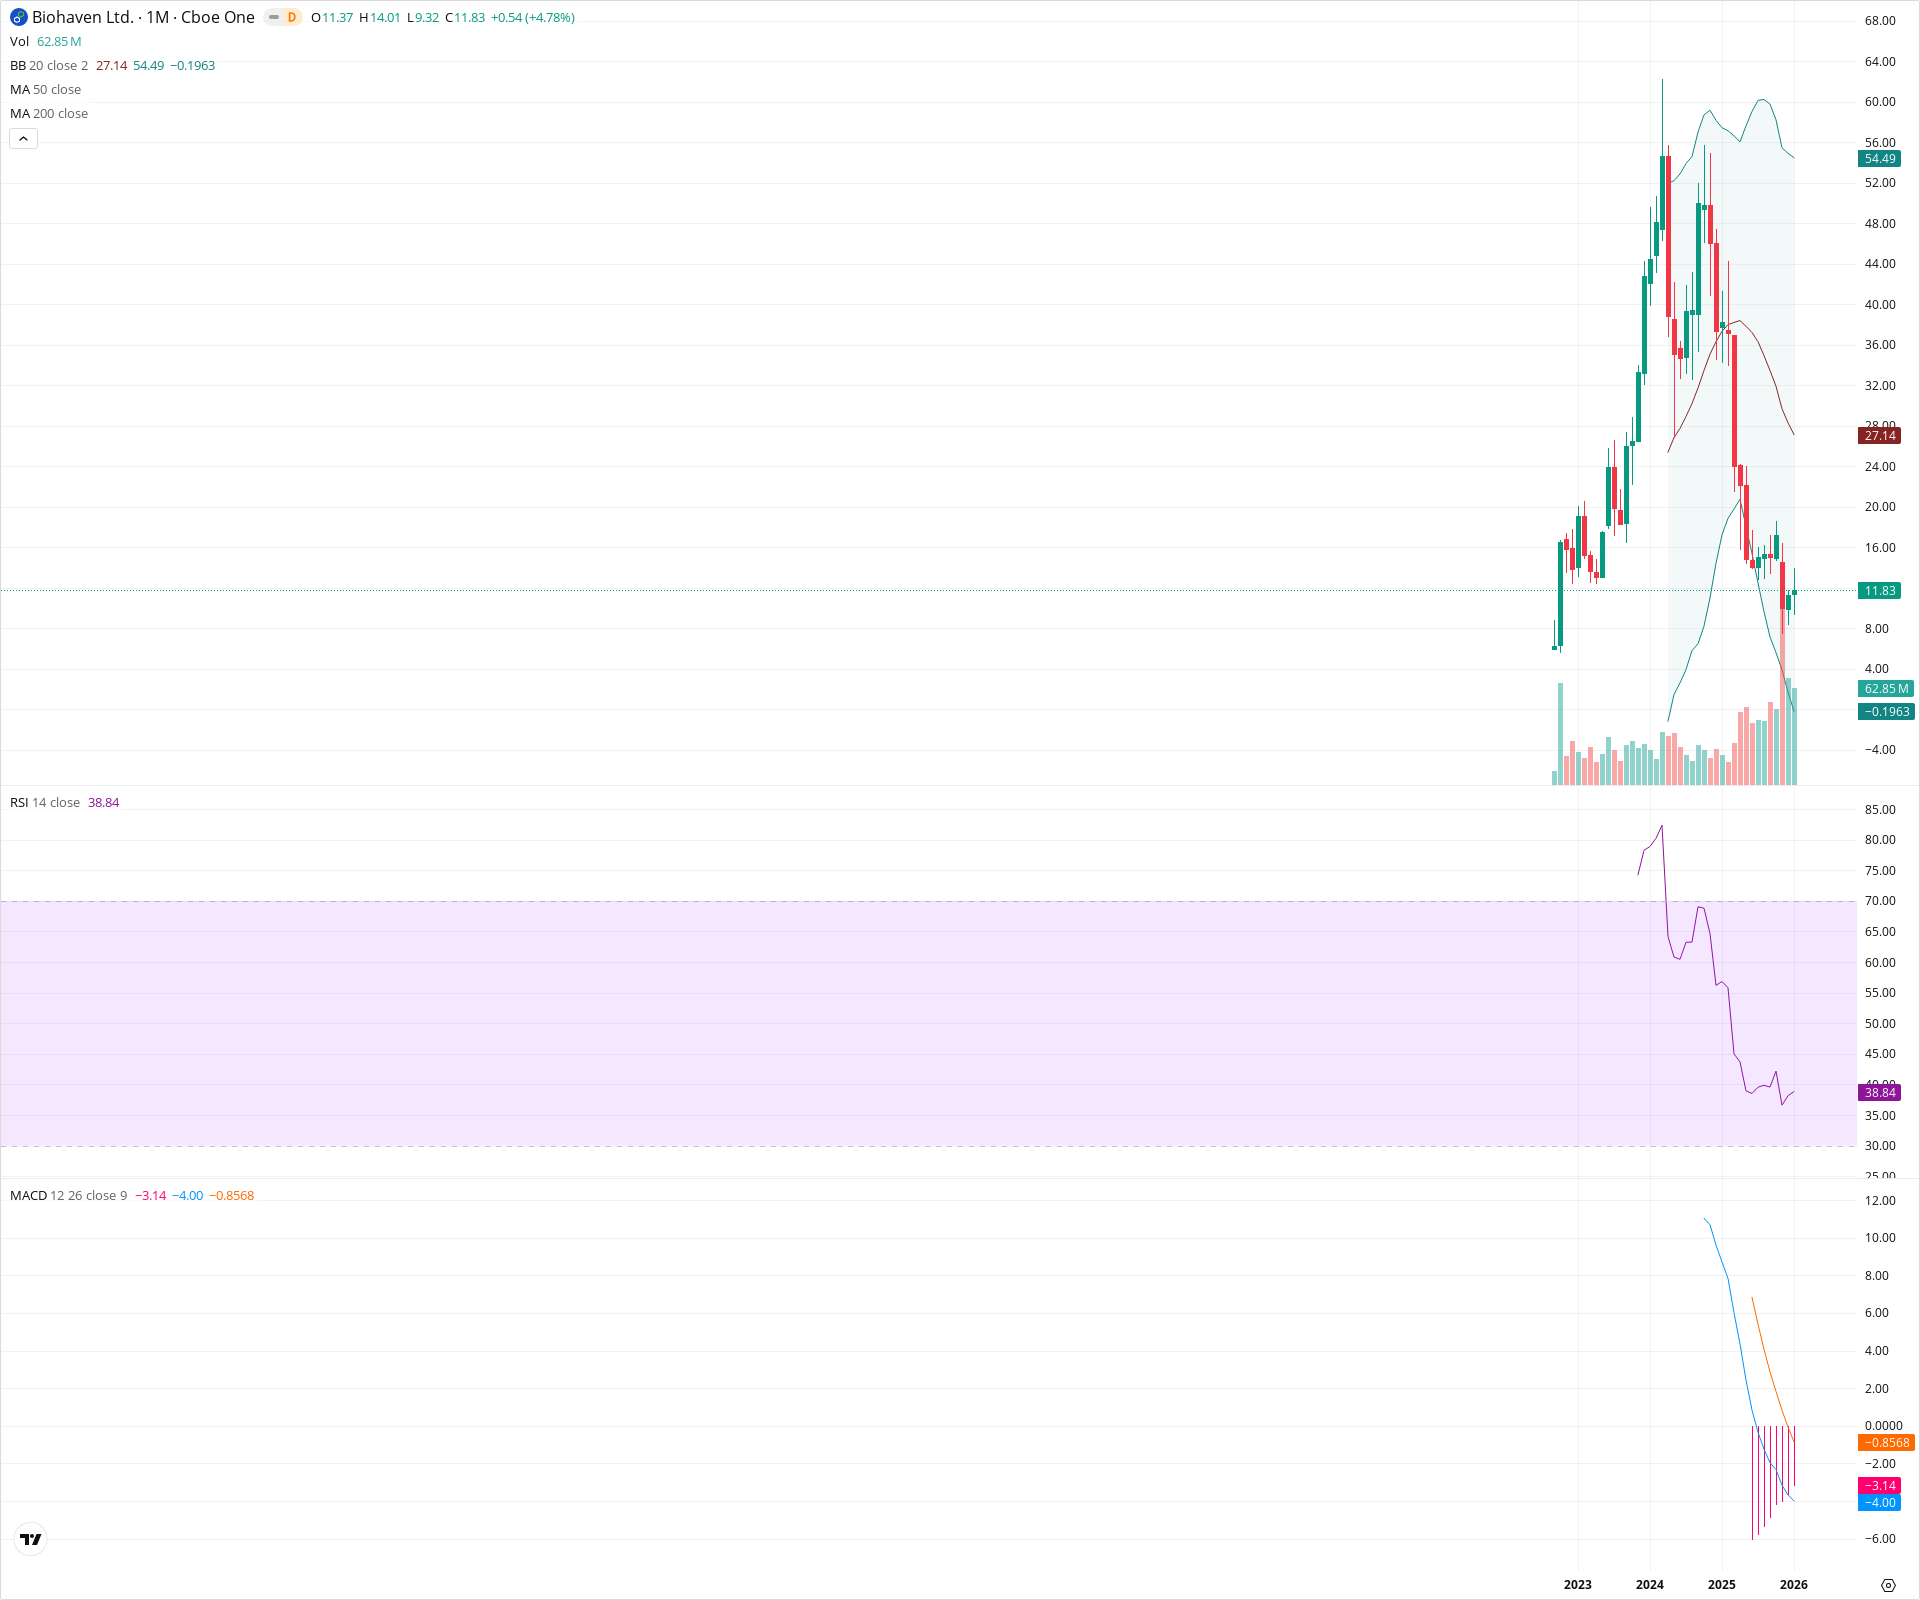
Biohaven Ltd. has experienced a massive boom-and-bust cycle, with price collapsing approximately 80% from its highs to revisit historical support around the 9.00–12.00 zone. While the current monthly candle shows a slight stabilizing bounce, the secular trend is deeply bearish with broken market structure and negative momentum. Investors should watch for a base to form at these inception levels, but overhead resistance at the 20 SMA remains formidable.
Included In Lists
Related Tickers of Interest
BHVN Monthly Chart
Sentiment
Short-term Sentiment (days to weeks): Bearish
Price remains in a steep downtrend despite a minor monthly bounce. Momentum indicators like MACD are deeply negative, and the price is significantly below the 20-month SMA.
Long-term Sentiment (weeks to months): Bearish
The chart displays a complete 'round trip' structural collapse, erasing all gains from the 2024-2025 rally. Price is trading well below major moving averages with a bearish MACD regime, indicating a secular downtrend.
Report Metadata
- Timeframe: monthly
- Generated at: 2026-02-02T05:32:02.612Z
- Model: gemini-3-pro-preview
Support Price Levels
| Level | Range | Strength | Notes |
|---|---|---|---|
| $10.66 | $9.32 - $12.00 | Strong | Current swing low and historical launch/base area visible at the start of the chart (early 2023). |
Resistance Price Levels
| Level | Range | Strength | Notes |
|---|---|---|---|
| $18.00 | $16.00 - $20.00 | Weak | Previous consolidation zone and breakdown level before the recent capitulation. |
| $27.32 | $27.14 - $27.50 | Strong | Coincides with the 20-month SMA and the Bollinger Band basis line, acting as dynamic resistance. |
Potential Chart Patterns in Formation
| Strength | Pattern | Signal | Target | Details |
|---|---|---|---|---|
| Strong | Blow-Off Top / Round Trip | Bearish | N/A | Price exhibited a parabolic rise to ~60.00 followed by an equally aggressive vertical collapse, returning to historical base levels. |
Frequently Asked Questions about BHVN
What is the current sentiment for BHVN?
The short-term sentiment for BHVN is currently Bearish because Price remains in a steep downtrend despite a minor monthly bounce. Momentum indicators like MACD are deeply negative, and the price is significantly below the 20-month SMA.. The long-term trend is classified as Bearish.
What are the key support levels for BHVN?
StockDips.AI has identified key support levels for BHVN at $10.66. These levels may represent potential accumulation zones where buying interest could emerge.
Is BHVN in a significant dip or a Value Dip right now?
BHVN has a Value Score of 74/100. It is currently flagged as a significant dip in the Top Dips list. It is not listed as a Value Dip because the long-term sentiment or value-score threshold does not qualify.
View the full interactive analysis on StockDips.AI.