PFE Daily Technical Analysis
Pfizer Inc.
Global pharmaceutical company specializing in vaccines, oncology, and infectious disease treatments. Known for major blockbuster drugs and vaccine platforms.
PFE Technical Analysis Summary
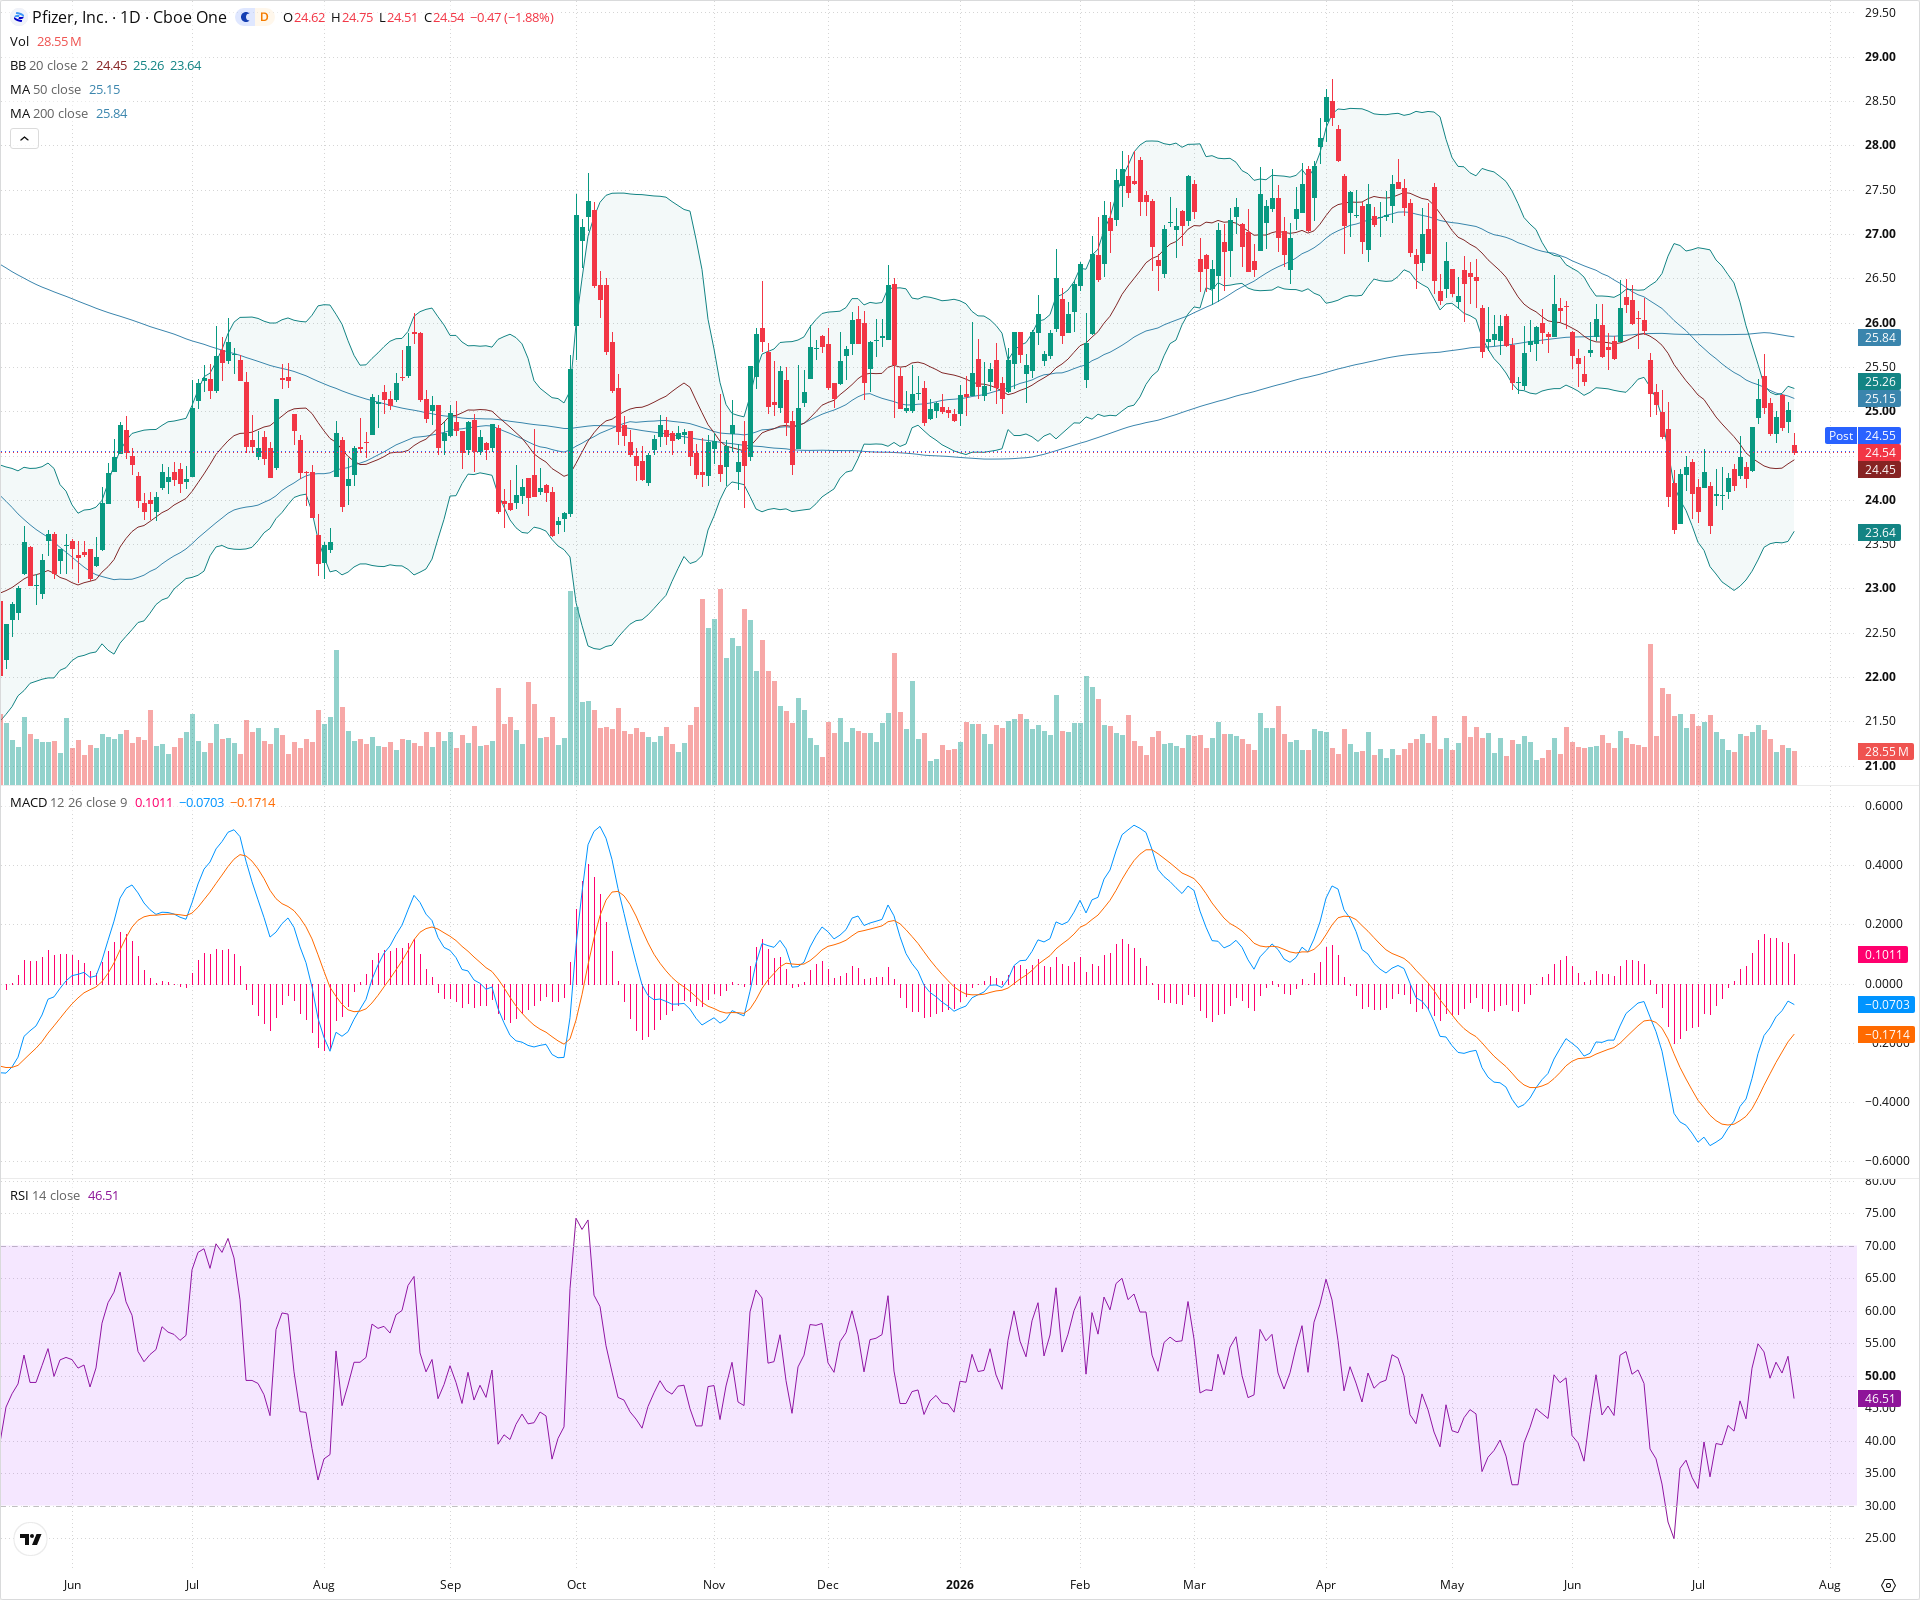
PFE remains entrenched in a primary long-term downtrend, characterized by price action below a declining 200-day moving average. A recent counter-trend rally failed at resistance near the 50-day SMA, resulting in a lower high and shifting short-term momentum indicators back to bearish. Long-term investors should exercise caution until the stock can build a durable base and break above the 200-day SMA.
Included In Lists
Related Tickers of Interest
PFE Daily Chart
Sentiment
Short-term Sentiment (days to weeks): Bearish
Price recently rejected at the 50-day SMA and upper Bollinger Band, accompanied by a bearish MACD crossover and RSI falling back below 50.
Long-term Sentiment (weeks to months): Bearish
The stock remains in a clear long-term downtrend, making lower highs and lower lows while trading consistently below a downward-sloping 200-day SMA.
Report Metadata
- Timeframe: daily
- Generated at: 2026-07-24T21:11:10.699Z
- Model: gemini-3.1-pro-preview
Support Price Levels
| Level | Range | Strength | Notes |
|---|---|---|---|
| $24.15 | $24.00 - $24.30 | Weak | Minor consolidation zone from early July before the final leg down to the major low. |
| $23.65 | $23.50 - $23.80 | Strong | Recent major swing low established in late July. |
Resistance Price Levels
| Level | Range | Strength | Notes |
|---|---|---|---|
| $25.30 | $25.10 - $25.50 | Strong | Confluence of the recent swing high peak and the 50-day SMA. |
| $26.00 | $25.80 - $26.20 | Strong | Zone containing the declining 200-day SMA and previous structural highs from early June. |
Potential Chart Patterns in Formation
| Strength | Pattern | Signal | Target | Details |
|---|---|---|---|---|
| Strong | Lower High Formation | Bearish | N/A | The recent relief rally peaked near 25.50, establishing a high lower than previous peaks, which confirms the continuation of the primary downtrend. |
| Weak | Bearish Momentum Shift | Bearish | N/A | MACD line has crossed below the signal line and the histogram is turning negative, indicating a loss of upward momentum after the recent bounce. |
Frequently Asked Questions about PFE
What is the current sentiment for PFE?
The short-term sentiment for PFE is currently Bearish because Price recently rejected at the 50-day SMA and upper Bollinger Band, accompanied by a bearish MACD crossover and RSI falling back below 50.. The long-term trend is classified as Bearish.
What are the key support levels for PFE?
StockDips.AI has identified key support levels for PFE at $24.15 and $23.65. These levels may represent potential accumulation zones where buying interest could emerge.
Is PFE in a significant dip or a Value Dip right now?
PFE has a Value Score of 65/100. It is not currently flagged as a significant dip in the Top Dips list. It is not listed as a Value Dip because the long-term sentiment or value-score threshold does not qualify.
View the full interactive analysis on StockDips.AI.