LLY Daily Technical Analysis
Eli Lilly & Co.
Pharma leader in diabetes and obesity treatments including Mounjaro and Zepbound.
LLY Technical Analysis Summary
LLY is in a well-established long-term uptrend, demonstrating technical strength by holding above key moving averages. The recent pullback appears to be a healthy correction that found strong support at the 50-day SMA. With short-term momentum indicators turning positive, the technical setup favors a retest of recent highs as long as the support zone near 1140 is maintained.
Included In Lists
Related Tickers of Interest
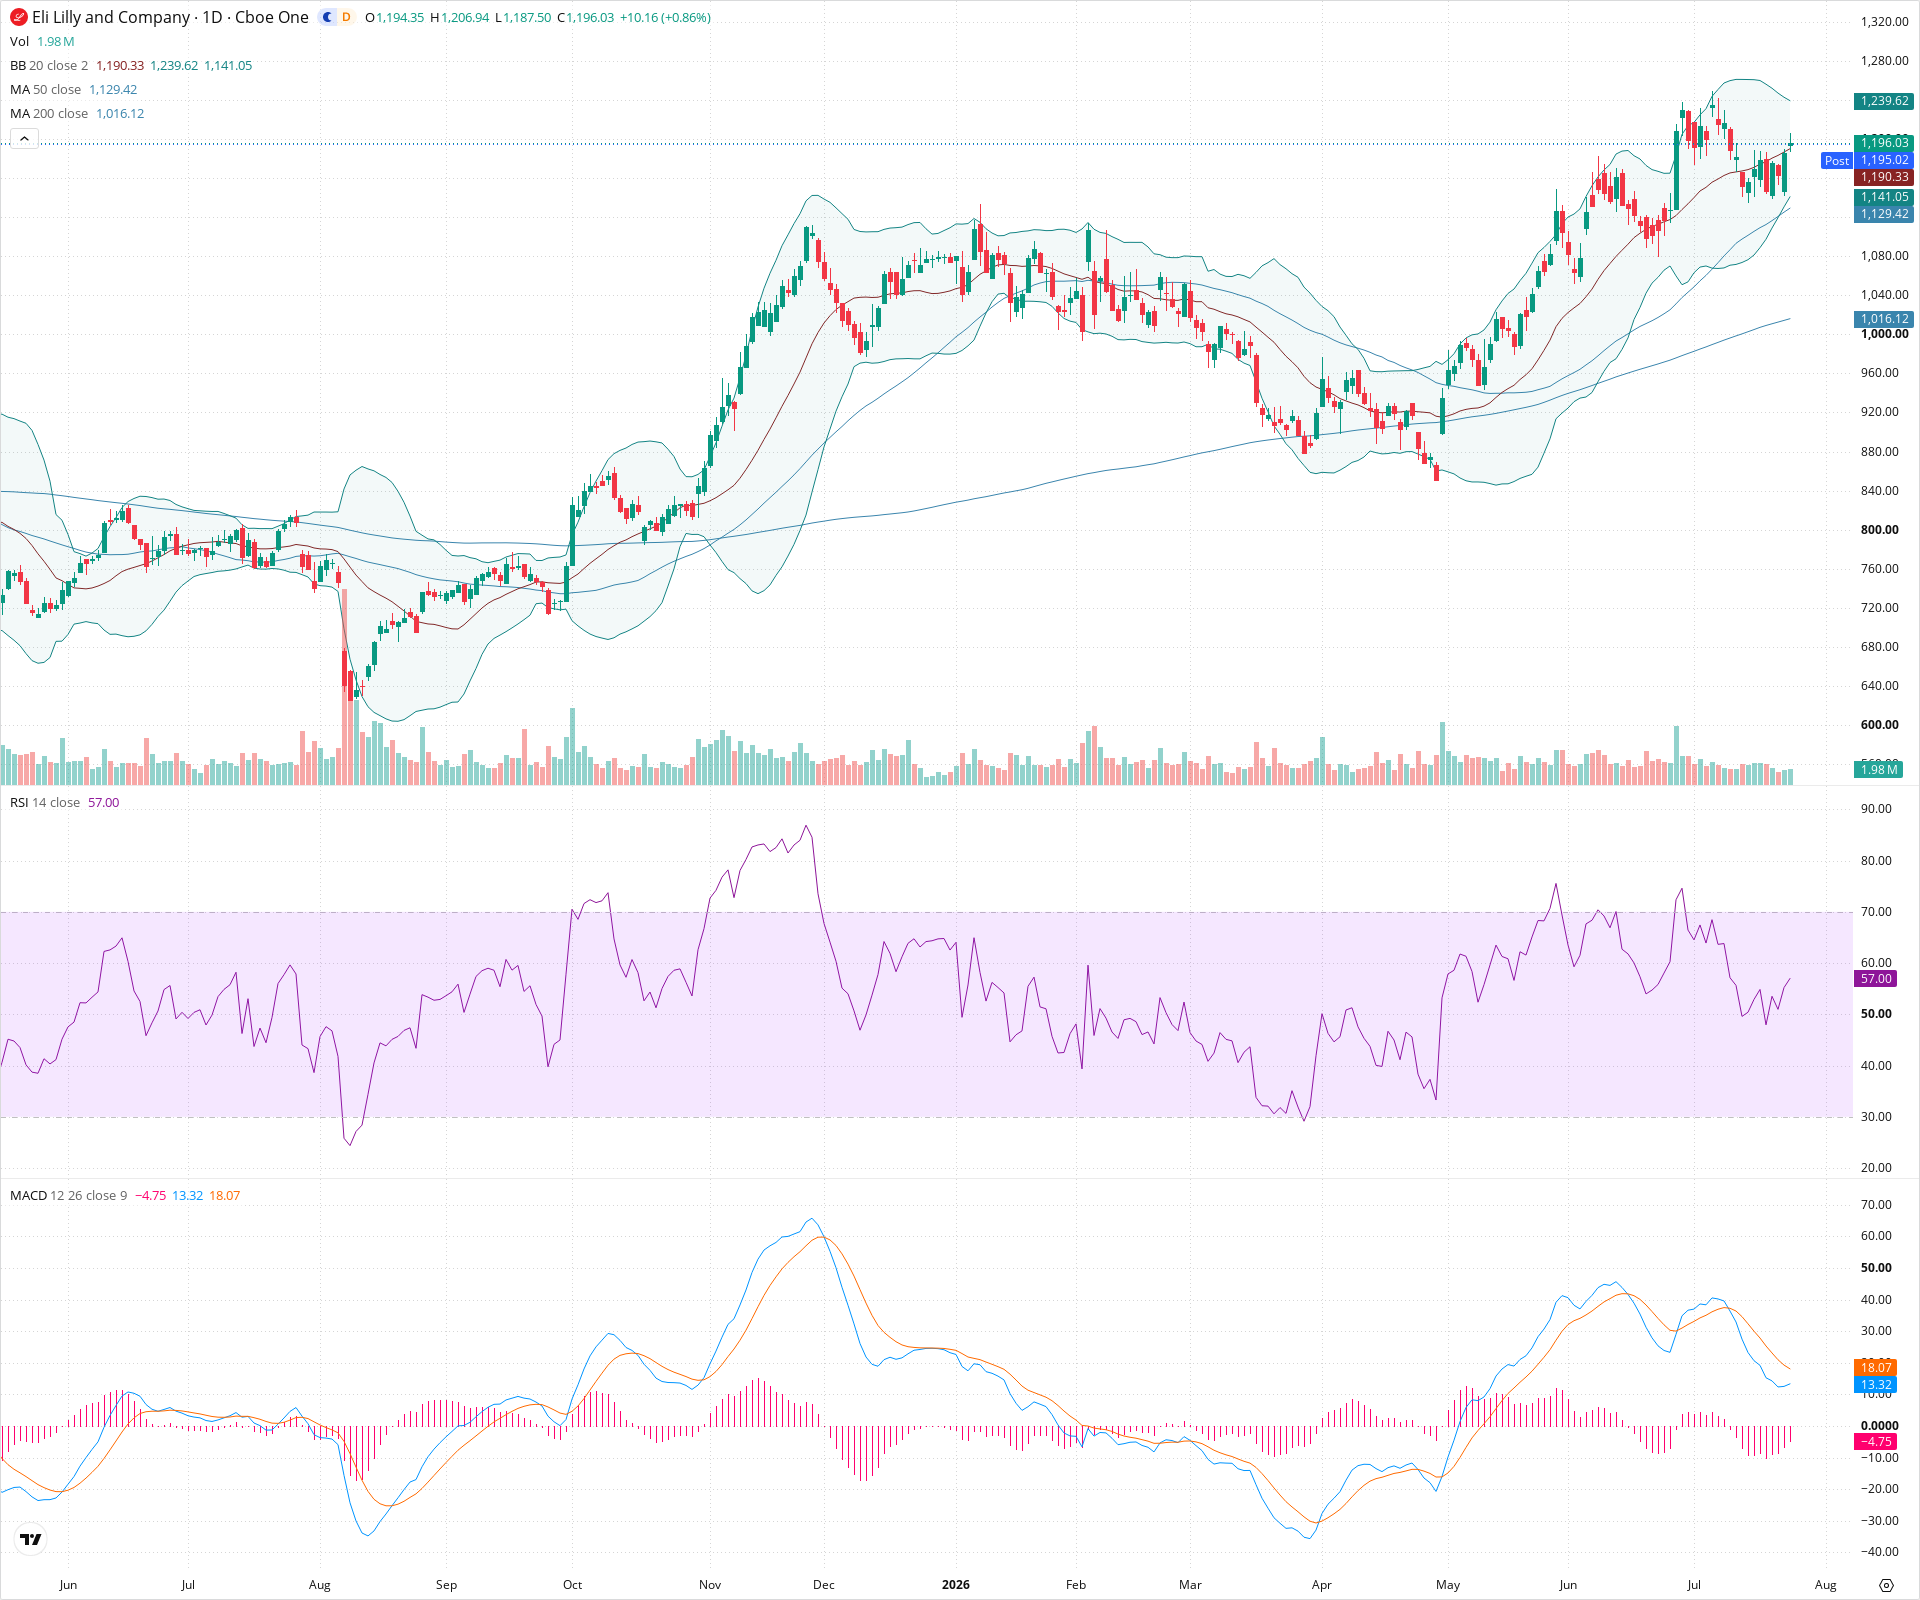
LLY Daily Chart
Sentiment
Short-term Sentiment (days to weeks): Bullish
Price successfully tested the 50-day SMA as support and has rebounded above the 20-day SMA. RSI is rising back above 50, and the MACD histogram is contracting toward zero, suggesting waning bearish momentum and a potential bullish crossover.
Long-term Sentiment (weeks to months): Bullish
The chart displays a robust and sustained uptrend characterized by a sequence of higher highs and higher lows. The price remains comfortably above both the rising 50-day and 200-day simple moving averages.
Report Metadata
- Timeframe: daily
- Generated at: 2026-07-24T21:03:52.699Z
- Model: gemini-3.1-pro-preview
Support Price Levels
| Level | Range | Strength | Notes |
|---|---|---|---|
| $1,140.00 | $1,130.00 - $1,150.00 | Strong | Recent swing low coinciding closely with the rising 50-day SMA. |
| $1,090.00 | $1,080.00 - $1,100.00 | Strong | Prior area of choppy consolidation before the most recent leg higher. |
Resistance Price Levels
| Level | Range | Strength | Notes |
|---|---|---|---|
| $1,242.50 | $1,235.00 - $1,250.00 | Strong | Recent swing high / all-time high area before the recent pullback. |
Potential Chart Patterns in Formation
| Strength | Pattern | Signal | Target | Details |
|---|---|---|---|---|
| Strong | Moving Average Bounce | Bullish | N/A | Price corrected down to the rising 50-day SMA, found support, and is establishing a new swing low, indicating trend continuation. |
Frequently Asked Questions about LLY
What is the current sentiment for LLY?
The short-term sentiment for LLY is currently Bullish because Price successfully tested the 50-day SMA as support and has rebounded above the 20-day SMA. RSI is rising back above 50, and the MACD histogram is contracting toward zero, suggesting waning bearish momentum and a potential bullish crossover.. The long-term trend is classified as Bullish.
What are the key support levels for LLY?
StockDips.AI has identified key support levels for LLY at $1,140.00 and $1,090.00. These levels may represent potential accumulation zones where buying interest could emerge.
Is LLY in a significant dip or a Value Dip right now?
LLY has a Value Score of 45/100. It is not currently flagged as a significant dip in the Top Dips list. It is not listed as a Value Dip because the long-term sentiment or value-score threshold does not qualify.
View the full interactive analysis on StockDips.AI.