ABBV Daily Technical Analysis
AbbVie Inc.
Biopharmaceutical company focused on immunology, oncology, aesthetics, and neuroscience; best known for Humira and newer drugs like Skyrizi and Rinvoq.
ABBV Technical Analysis Summary
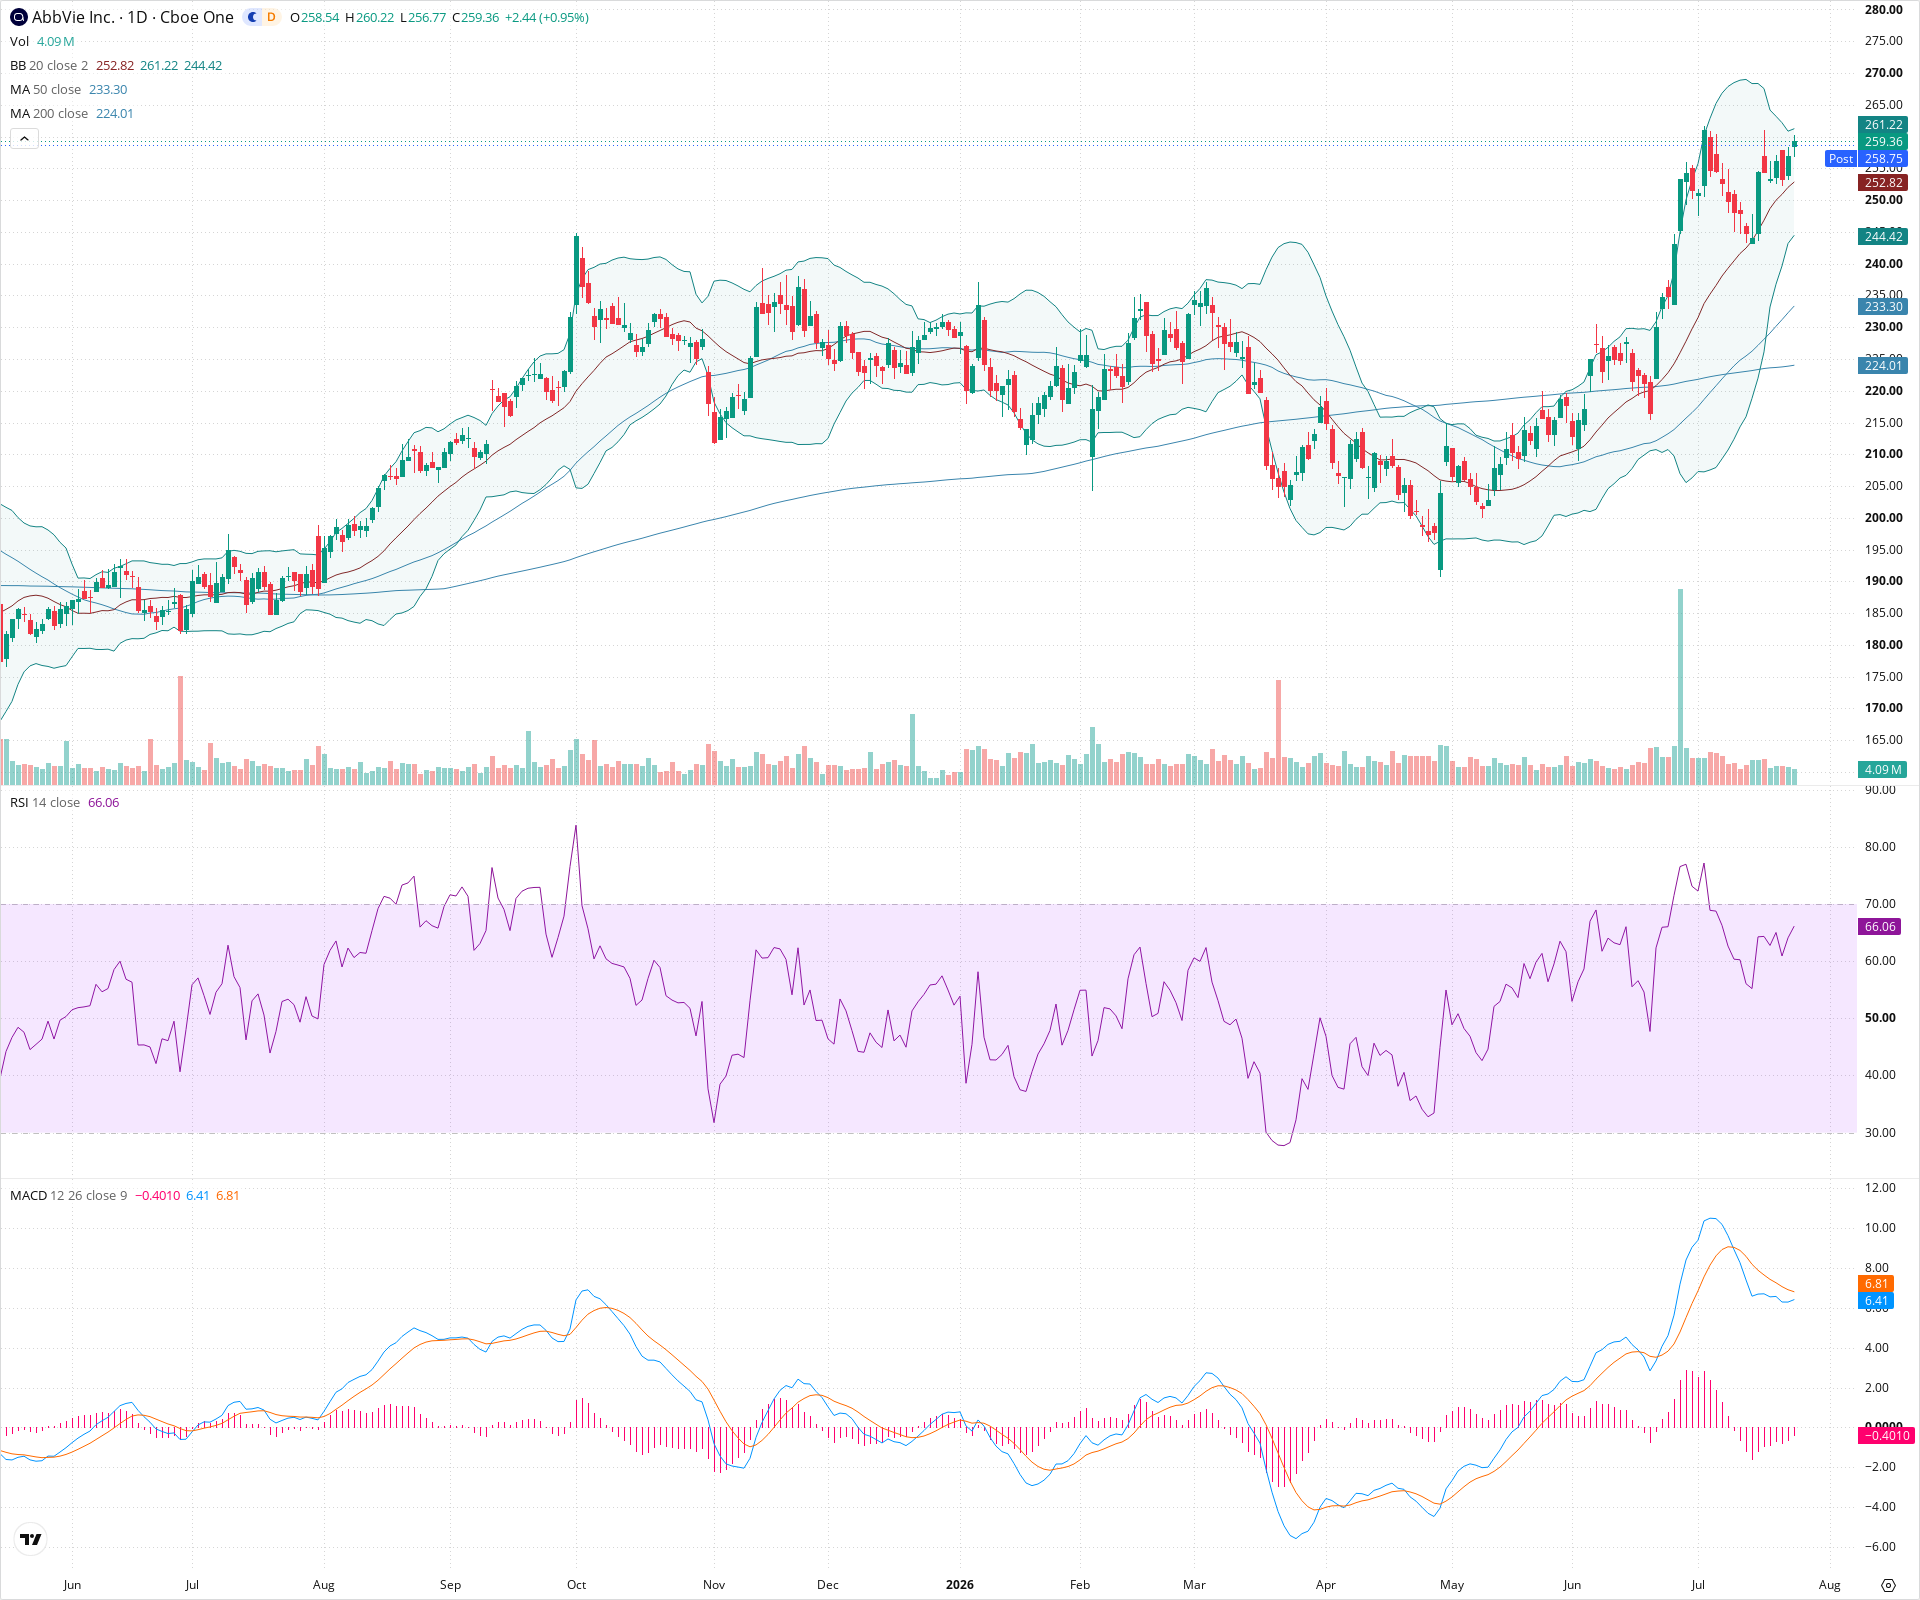
ABBV is in a clear, long-term uptrend, indicated by the strong upward slope of both the 50 and 200-day moving averages. Recently, the stock has experienced a sharp rally followed by a period of sideways consolidation. While short-term momentum indicators like the MACD are cooling off, the overall structure remains constructive for continued upside once this consolidation phase completes.
Included In Lists
Related Tickers of Interest
ABBV Daily Chart
Sentiment
Short-term Sentiment (days to weeks): Neutral
Price is consolidating near recent highs, caught between the middle and upper Bollinger Bands. RSI is in bullish territory but flattening out. MACD histogram shows declining momentum, signaling short-term indecision.
Long-term Sentiment (weeks to months): Bullish
Price remains in a strong upward trend, trading well above both the 50-day and 200-day SMAs. The 50-day SMA is rising sharply and is positioned significantly above the rising 200-day SMA.
Report Metadata
- Timeframe: daily
- Generated at: 2026-07-24T21:13:25.800Z
- Model: gemini-3.1-pro-preview
Support Price Levels
| Level | Range | Strength | Notes |
|---|---|---|---|
| $250.00 | $248.00 - $252.00 | Strong | Recent consolidation area and near the 20-day SMA/middle Bollinger Band. |
| $232.50 | $230.00 - $235.00 | Strong | Major previous swing low and near the rising 50-day SMA. |
Resistance Price Levels
| Level | Range | Strength | Notes |
|---|---|---|---|
| $264.50 | $263.00 - $266.00 | Strong | Recent swing highs where price found significant selling pressure. |
| $273.50 | $272.00 - $275.00 | Weak | Psychological whole number level above current all-time highs. |
Potential Chart Patterns in Formation
| Strength | Pattern | Signal | Target | Details |
|---|---|---|---|---|
| Strong | Bull Flag / Consolidation | Bullish | N/A | After a strong vertical rally, the price has been consolidating in a tight range, potentially forming a bull flag or high base pattern before a continuation higher. |
Frequently Asked Questions about ABBV
What is the current sentiment for ABBV?
The short-term sentiment for ABBV is currently Neutral because Price is consolidating near recent highs, caught between the middle and upper Bollinger Bands. RSI is in bullish territory but flattening out. MACD histogram shows declining momentum, signaling short-term indecision.. The long-term trend is classified as Bullish.
What are the key support levels for ABBV?
StockDips.AI has identified key support levels for ABBV at $250.00 and $232.50. These levels may represent potential accumulation zones where buying interest could emerge.
Is ABBV in a significant dip or a Value Dip right now?
ABBV has a Value Score of 36/100. It is not currently flagged as a significant dip in the Top Dips list. It is not listed as a Value Dip because the long-term sentiment or value-score threshold does not qualify.
View the full interactive analysis on StockDips.AI.