BITF Weekly Technical Analysis
Bitfarms Ltd
Bitcoin mining, High-Performance Computing (HPC) and Artificial Intelligence (AI) infrastructure
BITF Technical Analysis Summary
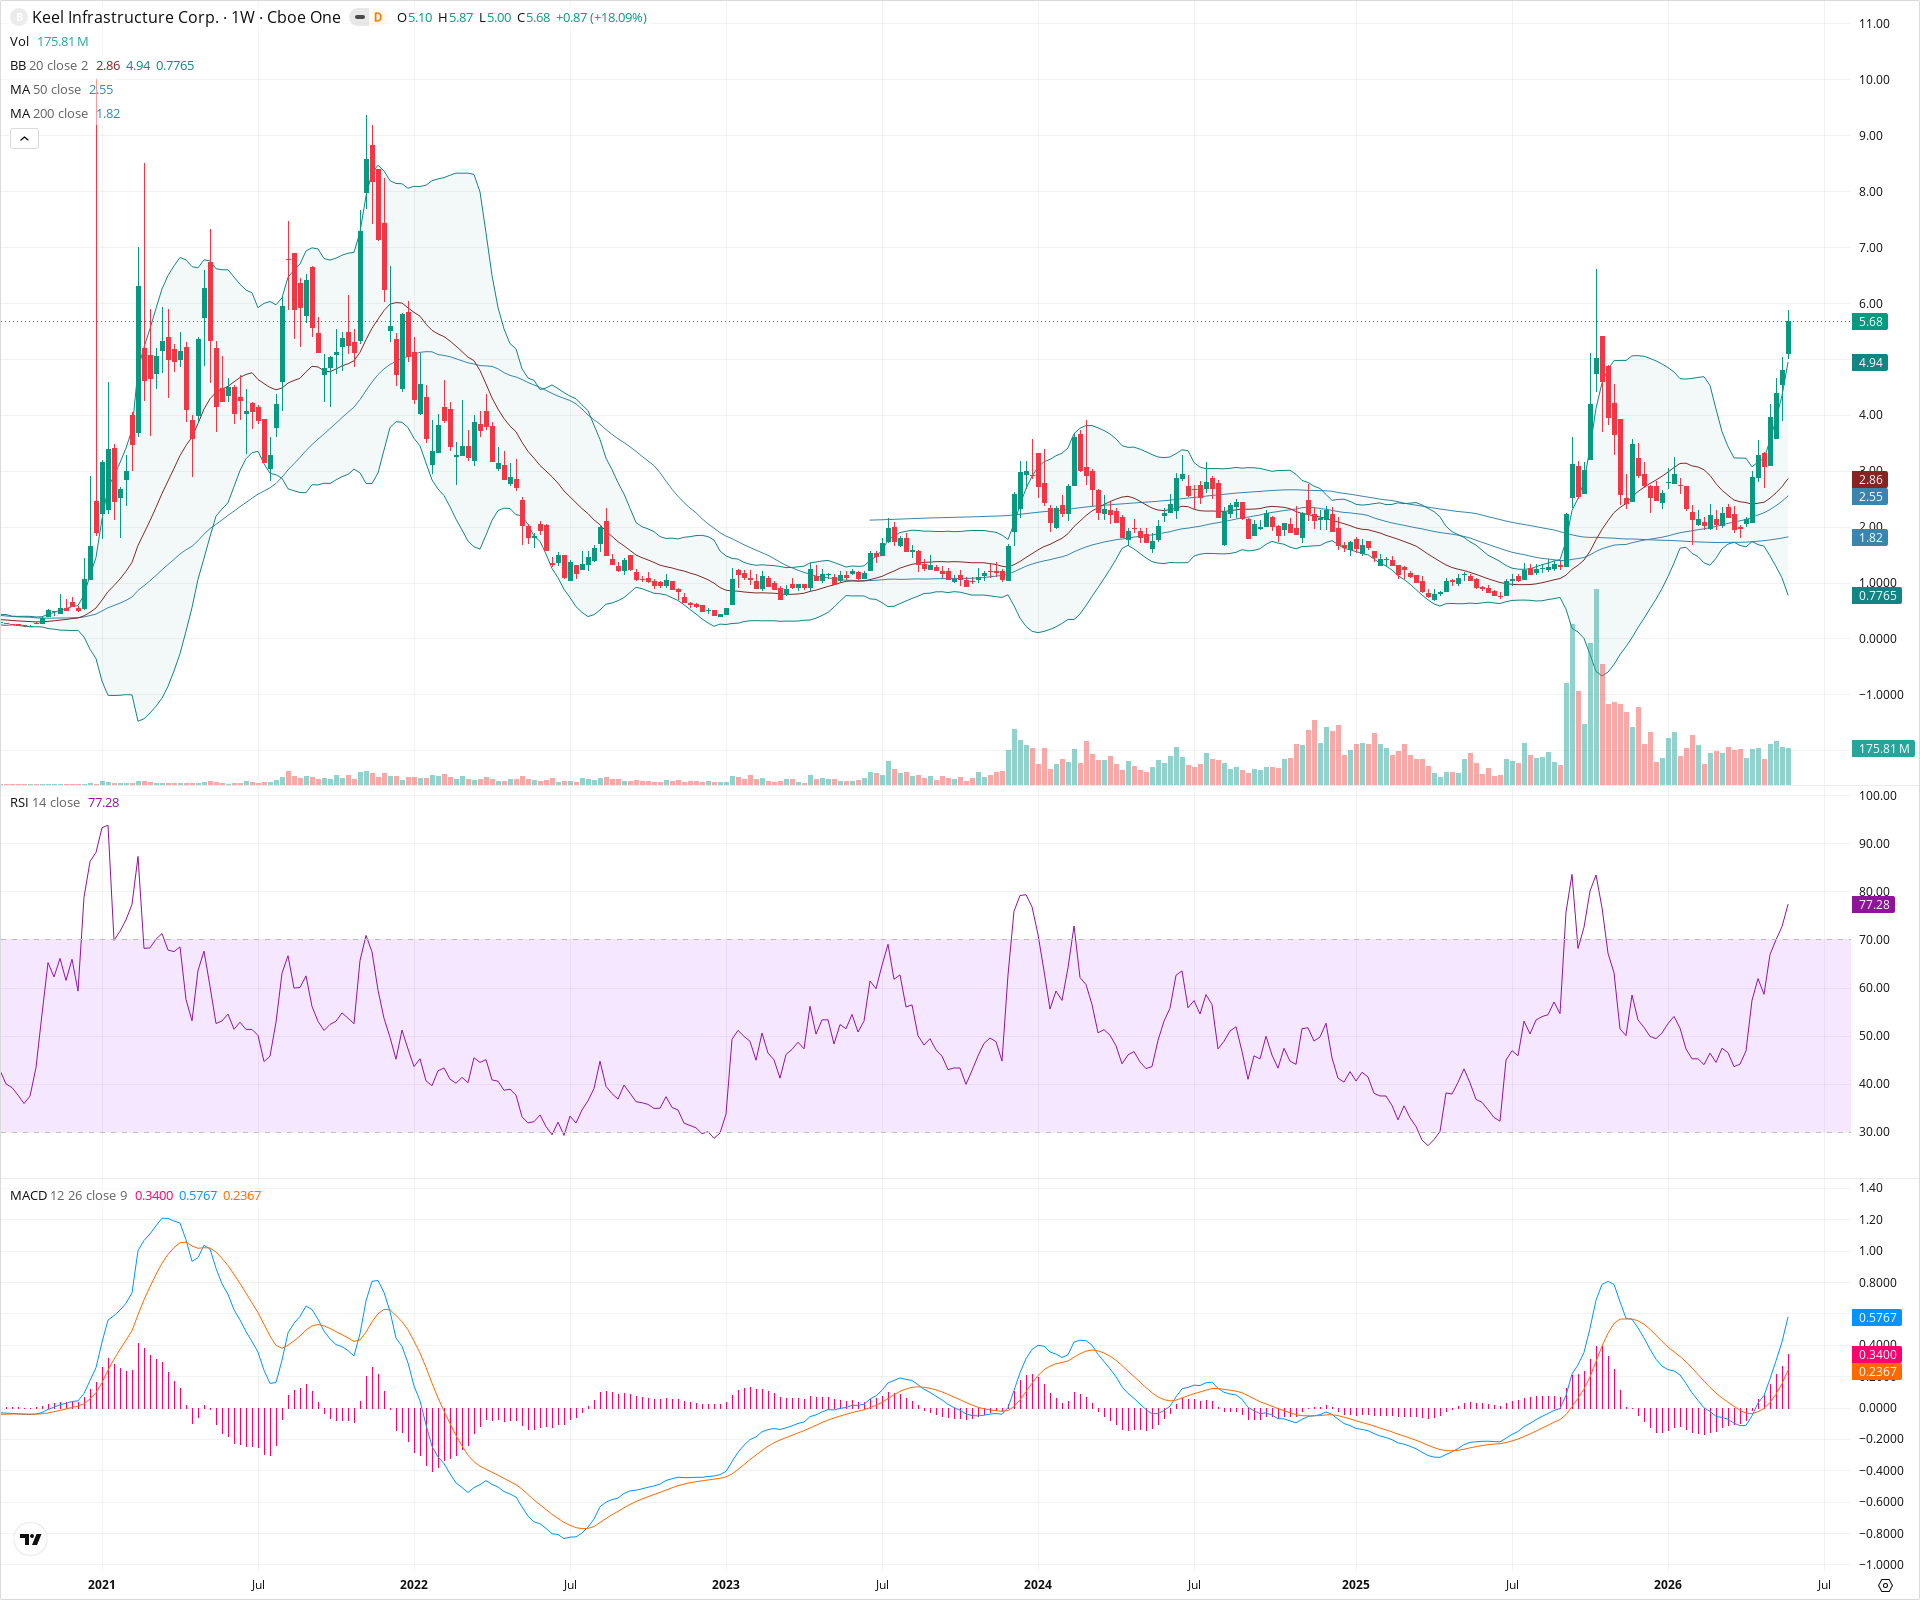
The weekly chart illustrates a powerful structural breakout from a multi-year base, driven by extraordinary volume and resulting in a parabolic price advance. The long-term trend has definitively shifted to bullish as price clears all major moving averages. However, with the RSI indicating deeply overbought conditions (above 75), investors should be mindful of potential near-term volatility and healthy pullbacks towards structural support zones before further sustained attempts at historical resistance levels.
Included In Lists
Related Tickers of Interest
BITF Weekly Chart
Sentiment
Short-term Sentiment (days to weeks): Bullish
Explosive upward price momentum on massive volume, with MACD showing a strong bullish crossover and an expanding positive histogram. While RSI is overbought, the sheer verticality dictates a strongly bullish immediate trend.
Long-term Sentiment (weeks to months): Bullish
Price has decisively broken out of a multi-year consolidation base and crossed significantly above the 50-week and 200-week SMAs, establishing a new and powerful long-term structural uptrend.
Report Metadata
- Timeframe: weekly
- Generated at: 2026-05-30T09:09:10.177Z
- Model: gemini-3.1-pro-preview
Support Price Levels
| Level | Range | Strength | Notes |
|---|---|---|---|
| $4.25 | $4.00 - $4.50 | Weak | First area of potential support on a pullback, derived from previous minor consolidation peaks prior to the current parabolic spike. |
| $2.75 | $2.50 - $3.00 | Strong | Major structural support zone comprising previous long-term consolidation highs and the rising confluence of the 20-week and 50-week SMAs. |
Resistance Price Levels
| Level | Range | Strength | Notes |
|---|---|---|---|
| $7.00 | $6.50 - $7.50 | Strong | Immediate major resistance zone based on prominent historical swing highs from 2021 visible on the left side of the chart. |
| $9.00 | $8.50 - $9.50 | Strong | Long-term historical resistance defined by the major peaks established near the beginning of the charted period. |
Potential Chart Patterns in Formation
| Strength | Pattern | Signal | Target | Details |
|---|---|---|---|---|
| Strong | Rounding Bottom Breakout | Bullish | N/A | A massive multi-year basing pattern characterized by a prolonged period of consolidation, culminating in a high-volume upward breakout from the long-term base. |
| Strong | Parabolic Advance | Bullish | N/A | Recent weeks display a near-vertical price ascent with expanding candlesticks, indicating extreme buying pressure but increasing the risk of a sharp mean-reversion pullback. |
Frequently Asked Questions about BITF
What is the current sentiment for BITF?
The short-term sentiment for BITF is currently Bullish because Explosive upward price momentum on massive volume, with MACD showing a strong bullish crossover and an expanding positive histogram. While RSI is overbought, the sheer verticality dictates a strongly bullish immediate trend.. The long-term trend is classified as Bullish.
What are the key support levels for BITF?
StockDips.AI has identified key support levels for BITF at $4.25 and $2.75. These levels may represent potential accumulation zones where buying interest could emerge.
Is BITF in a significant dip or a Value Dip right now?
BITF has a Value Score of 23/100. It is not currently flagged as a significant dip in the Top Dips list. It is not listed as a Value Dip because the long-term sentiment or value-score threshold does not qualify.
View the full interactive analysis on StockDips.AI.