BITF Monthly Technical Analysis
Bitfarms Ltd
Bitcoin mining, High-Performance Computing (HPC) and Artificial Intelligence (AI) infrastructure
BITF Technical Analysis Summary
Bitfarms Ltd. shows a constructive long-term recovery, having formed a rounding bottom and successfully reclaimed the critical 50-month moving average. While the long-term trend has shifted to bullish with positive MACD confirmation, the immediate outlook suggests consolidation as price digests gains near the upper Bollinger Band resistance. Investors should watch the 1.89–1.94 zone as critical support to maintain this new uptrend.
Included In Lists
Related Tickers of Interest
BITF Monthly Chart
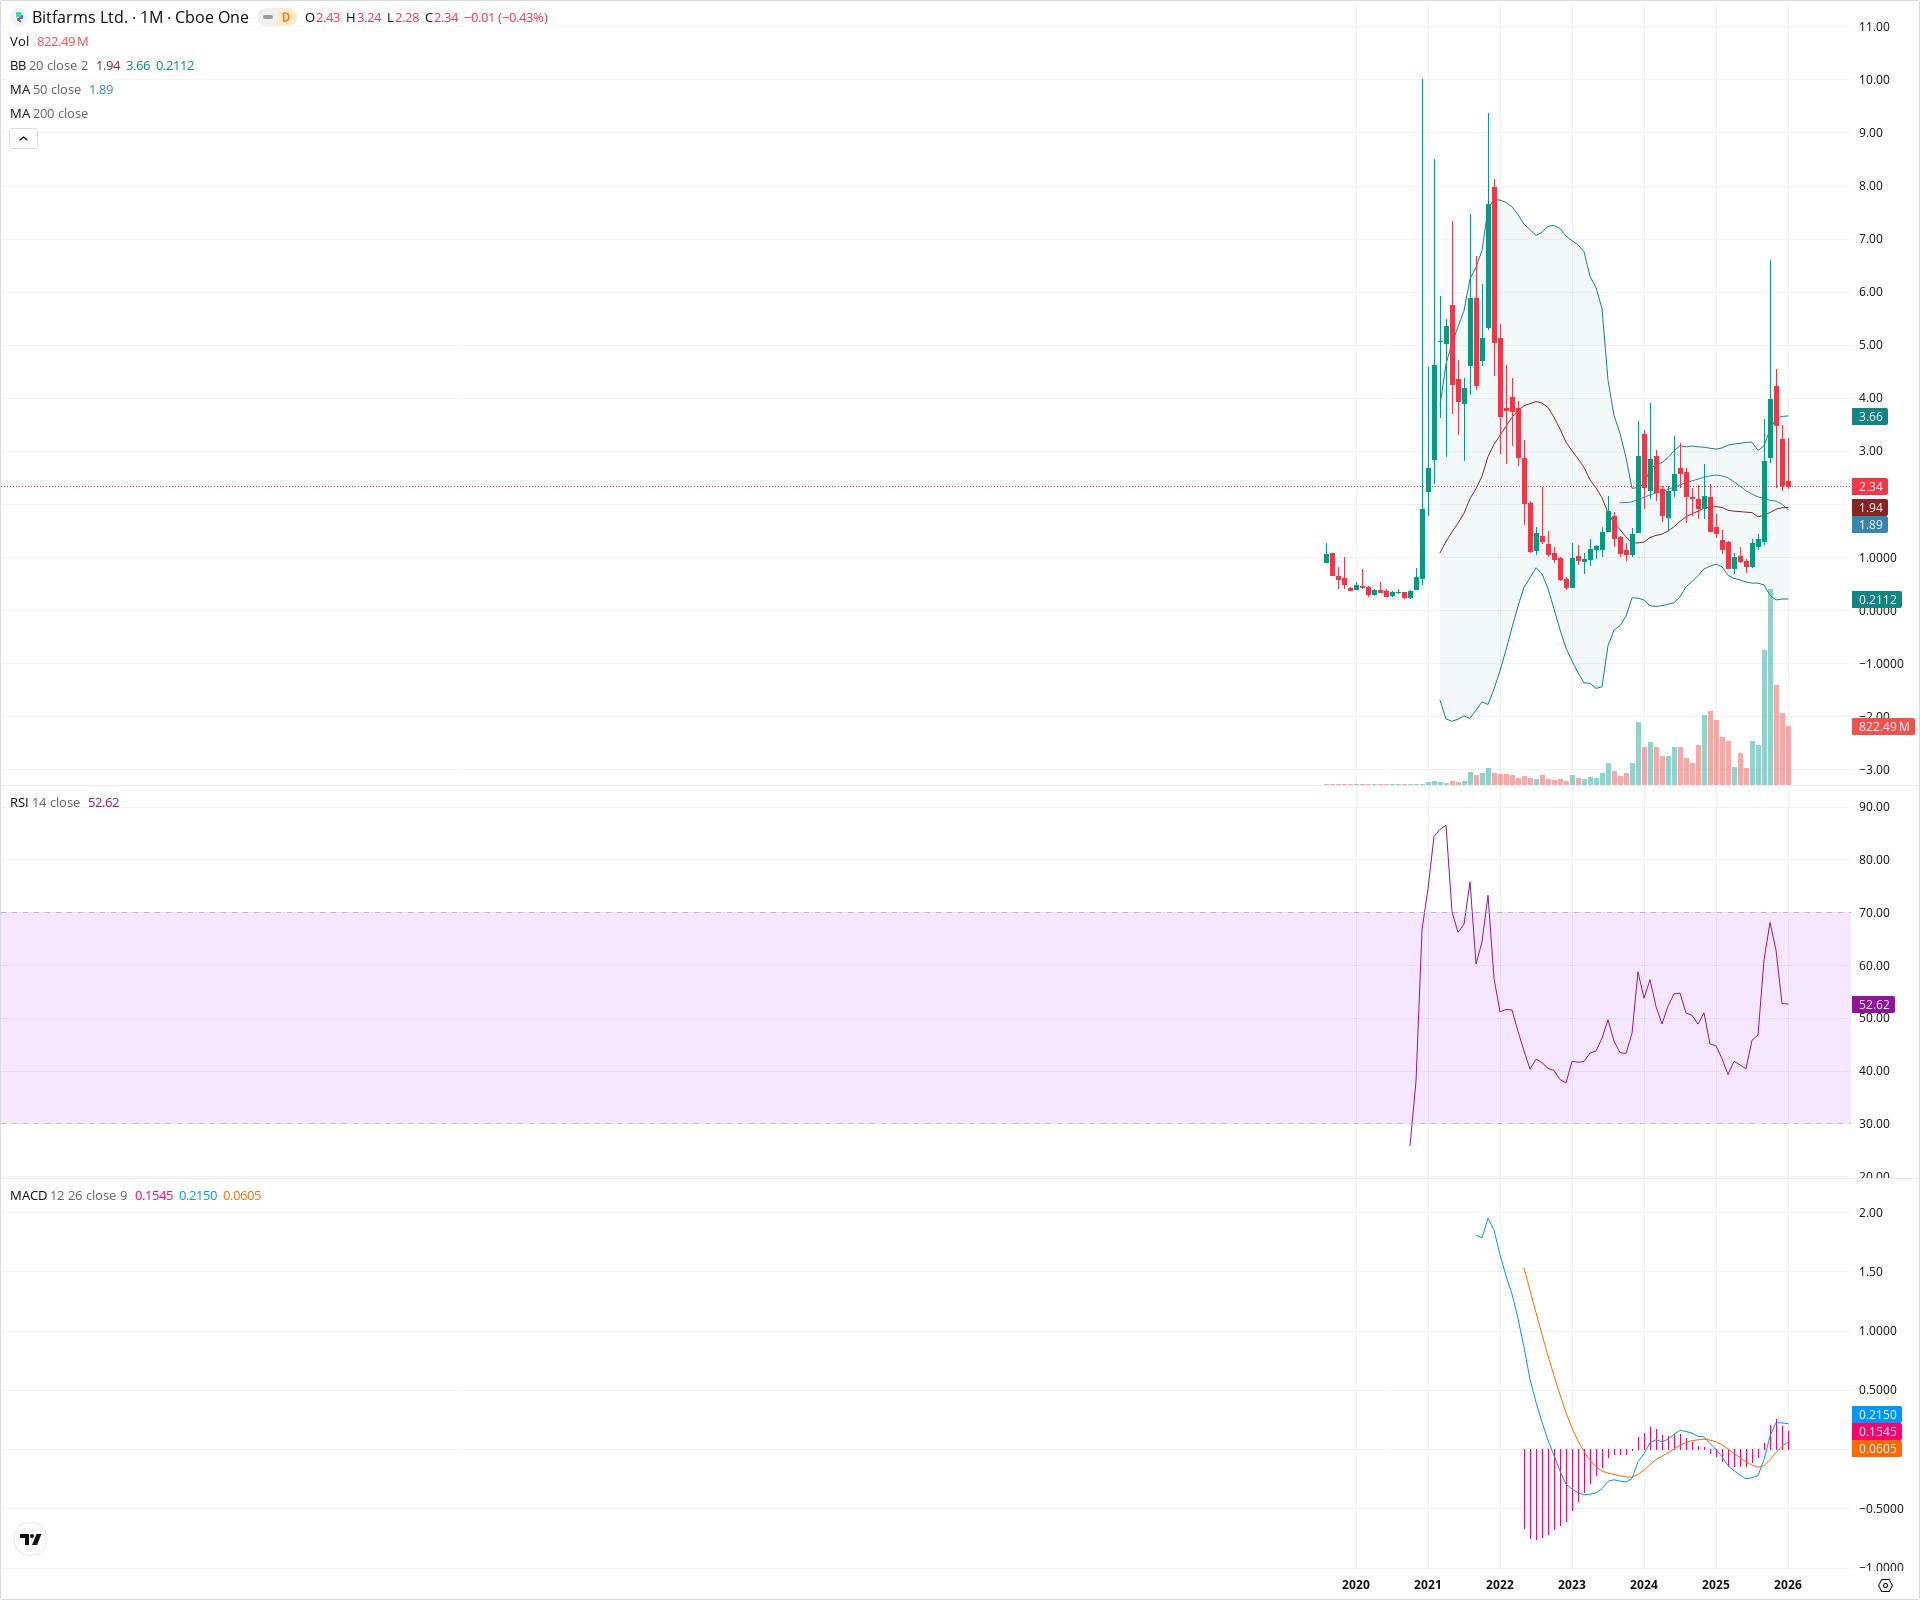
Sentiment
Short-term Sentiment (days to weeks): Neutral
Price is consolidating after a strong move, trading inside the previous month's range and retracing from the Upper Bollinger Band at 3.66. Momentum on the histogram is waning.
Long-term Sentiment (weeks to months): Bullish
The stock has established a multi-year rounding bottom and is now trading above both the 20-month and 50-month SMAs. The MACD is in positive territory, confirming a structural trend reversal.
Report Metadata
- Timeframe: monthly
- Generated at: 2026-02-02T05:31:56.015Z
- Model: gemini-3-pro-preview
Support Price Levels
| Level | Range | Strength | Notes |
|---|---|---|---|
| $1.92 | $1.89 - $1.94 | Strong | Confluence zone of the 50-month SMA (1.89) and the 20-month SMA (1.94). |
| $1.00 | $0.80 - $1.20 | Strong | Major secular base lows formed throughout 2022 and 2023. |
Resistance Price Levels
| Level | Range | Strength | Notes |
|---|---|---|---|
| $3.58 | $3.50 - $3.66 | Strong | Recent swing high coincides with the Upper Bollinger Band (3.66). |
| $5.50 | $5.00 - $6.00 | Weak | Previous structural breakdown zone from 2022 acting as potential future resistance. |
Potential Chart Patterns in Formation
| Strength | Pattern | Signal | Target | Details |
|---|---|---|---|---|
| Strong | Rounding Bottom | Bullish | $5.00 | A prolonged period of consolidation and gradual recovery following the 2022 crash, indicating long-term accumulation. |
Frequently Asked Questions about BITF
What is the current sentiment for BITF?
The short-term sentiment for BITF is currently Neutral because Price is consolidating after a strong move, trading inside the previous month's range and retracing from the Upper Bollinger Band at 3.66. Momentum on the histogram is waning.. The long-term trend is classified as Bullish.
What are the key support levels for BITF?
StockDips.AI has identified key support levels for BITF at $1.92 and $1.00. These levels may represent potential accumulation zones where buying interest could emerge.
Is BITF in a significant dip or a Value Dip right now?
BITF has a Value Score of 23/100. It is not currently flagged as a significant dip in the Top Dips list. It is not listed as a Value Dip because the long-term sentiment or value-score threshold does not qualify.
View the full interactive analysis on StockDips.AI.